
Demo-Graphics: Comic Fandom on Facebook – European Edition
We hinted at the return of some long-shelved regular features on the site, and the first back is Demo-Graphics! On Monday, we ran the statistics for comic fans within the United States and today (after a bit of a delay) we’re back with the first reporting of statistics from Europe!
What is Demo-Graphics?
Each month I dive into data from Facebook looking at the various demographics it can tell us about comic fans. This isn’t hard numbers but best used to show trends in the industry and the potential of the market out there. This has shown the shift towards women being a major force in readers and a shift to the younger demographic.
How does it work?
We use key terms, “likes”, that users have indicated and have come up with our own set to measure each month. There’s over 50 terms used (and no I won’t release them). We stick to specific terms for the industry such as “comics” and “graphic novels” and “one-shots” as well as publishers and leave out broad terms like specific characters or stories. Just because someone likes Batman doesn’t mean they like comics.
Other things to know…
This data is important in that it shows who the potential comic audience could be. These are not purchasers, these are people who have shown an affinity for comics and are potential purchasers and those with an interest.
Also, with this being online/technology, due to laws and restrictions, those under the age of 13 are underrepresented.
Since the last time this feature was run, Facebook has made adjustments as to what it can report so some data is no longer available and we’ve also added in new data that hasn’t been reported before (but some of it has been tracked over the years).
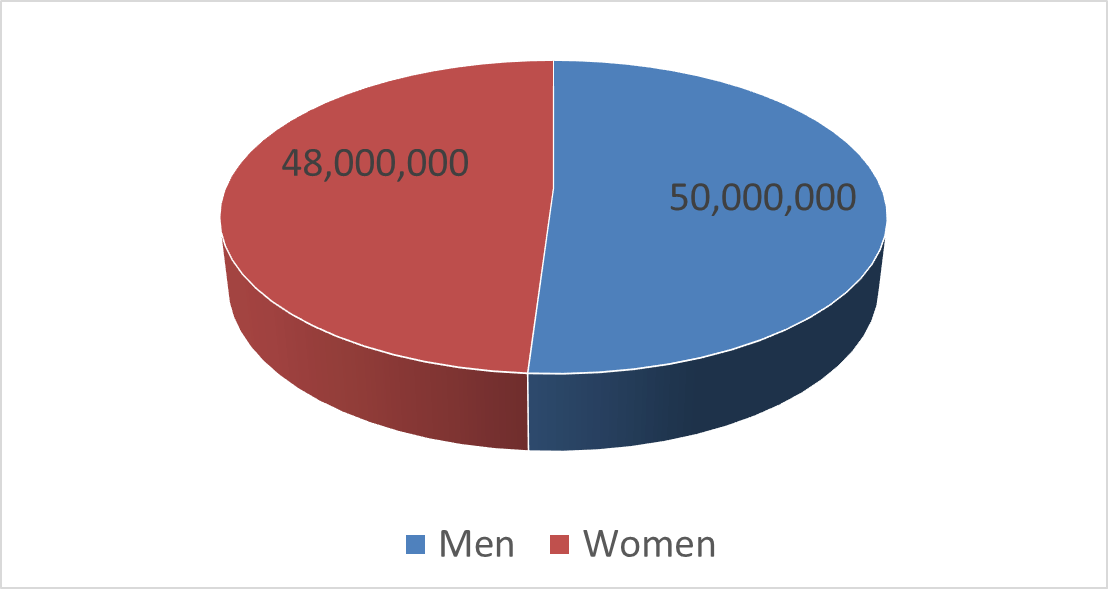
Facebook Population: Over 98,000,000 in Europe
That’s an increase of 8 million compared to the previous report that we ran in July 2018. That’s 28 million more individuals compared to what I reported for the United States earlier this week.
Gender and Age
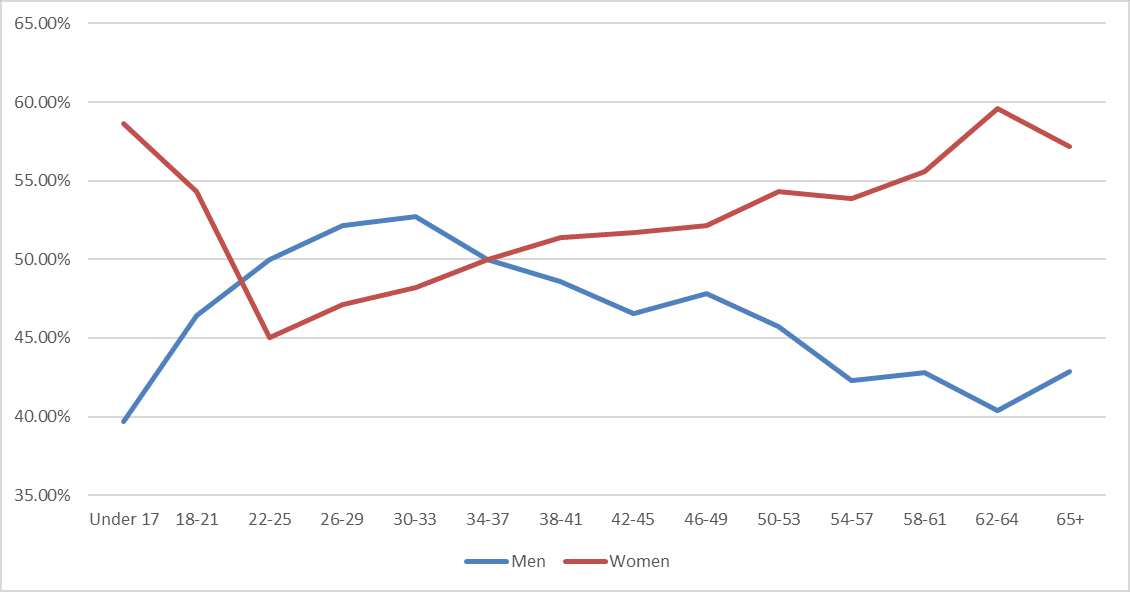
Interestingly, men account for the majority of fans. They account for 51.02% of the population compared to 48.98% of women. That’s a flip of the statistics in the United States where women are the majority. When looking at the data broken down by ages, women are a slight majority though with 50.54%. The relationship statistics show men as the majority. We’ll have to see if this continues in the coming months and if not, figure out the disconnect between the three statistics.
Similar to the previous month, things remain the same with men becoming a slim majority in the age 22-25 age group and then lose it in the 34-37 age group. It’s a similar statistic to the United States.
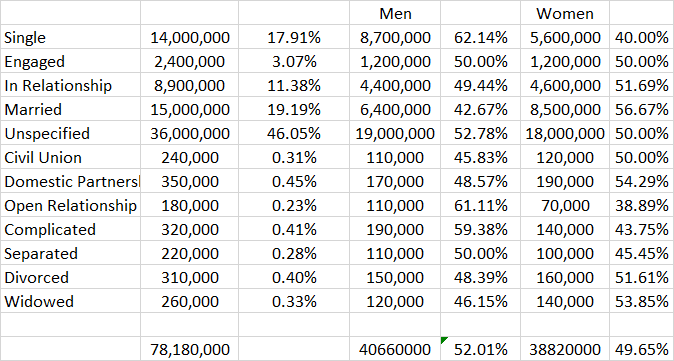
Relationship Status
Much like with the United States. I thought it’d be interesting to see how these statistics might have shifted. The overall population actually dropped over the two years, decreasing by about 5 million, even though the overall population has increased.
Other highlights:
- “Single” individuals decreased by about 3 million
- “In Relationship” decreased by 1.1 million
- “Married” increased by 3 million
- “Unspecified” decreased by 4 million
Education
For education, I did a look comparing some of the statistics for what I could find about Europe and it lines up pretty well. Compared to the previous reporting in 2018, the data hasn’t shifted much unlike the United States which saw a significant change.

Up next, we’ll compare the two groups of comic fans!
Discover more from Graphic Policy
Subscribe to get the latest posts sent to your email.