
Demo-Graphics: Comic Fandom on Facebook – US Edition
We hinted at the return of some long-shelved regular features on the site, and the first back is Demo-Graphics!
What is Demo-Graphics?
Each month I dive into data from Facebook looking at the various demographics it can tell us about comic fans. This isn’t hard numbers but best used to show trends in the industry and the potential of the market out there. This has shown the shift towards women being a major force in readers and a shift to the younger demographic.
How does it work?
We use key terms, “likes”, that users have indicated and have come up with our own set to measure each month. There’s over 50 terms used (and no I won’t release them). We stick to specific terms for the industry such as “comics” and “graphic novels” and “one-shots” as well as publishers and leave out broad terms like specific characters or stories. Just because someone likes Batman doesn’t mean they like comics.
Other things to know…
This data is important in that it shows who the potential comic audience could be. These are not purchasers, these are people who have shown an affinity for comics and are potential purchasers and those with an interest.
Also, with this being online/technology, due to laws and restrictions, those under the age of 13 are underrepresented.
Since the last time this feature was run, Facebook has made adjustments as to what it can report so some data is no longer available and we’ve also added in new data that hasn’t been reported before (but some of it has been tracked over the years).
Facebook Population: Around 70 million in the United States
We last ran this report in October 2018 which saw over 73 million individuals reported. Things have dipped over the years but the amount of individuals is still massive. Men remained steady at 33 million while women dipped to 37 million over that time frame.
The Spanish-speaking population in October 2018 was 13.7%, a little over 2 years later, that number has remained relatively the same at 13.29%.
NEW: Comics focused on kids has been an explosive area of growth over the years. The data tells us that 18.75% of comics fans are parents, that’s 13 million individuals!
Gender and Age
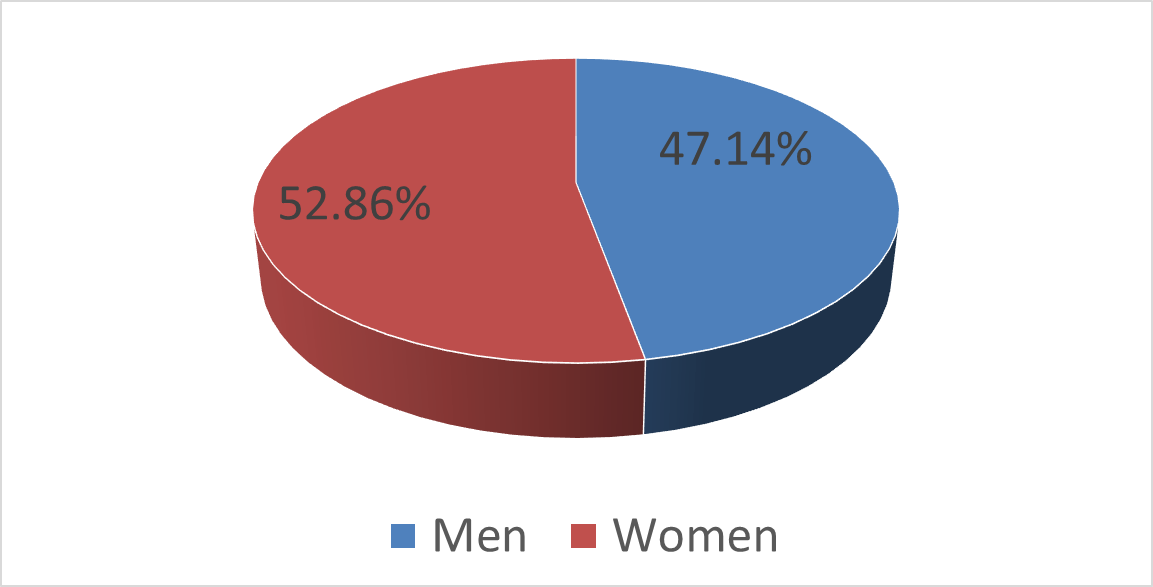
Women have been a majority for a long time in this reporting. They continue to be exactly that accounting for 52.86% of the comic fans compared to men at 47.14%. Women regularly became the majority of the fandom back in October 2017 when we first saw a 50/50 split in the demographics.
Facebook still is not good about placing gender in a binary, but it’s still a goal to better report beyond just the two regularly listed.
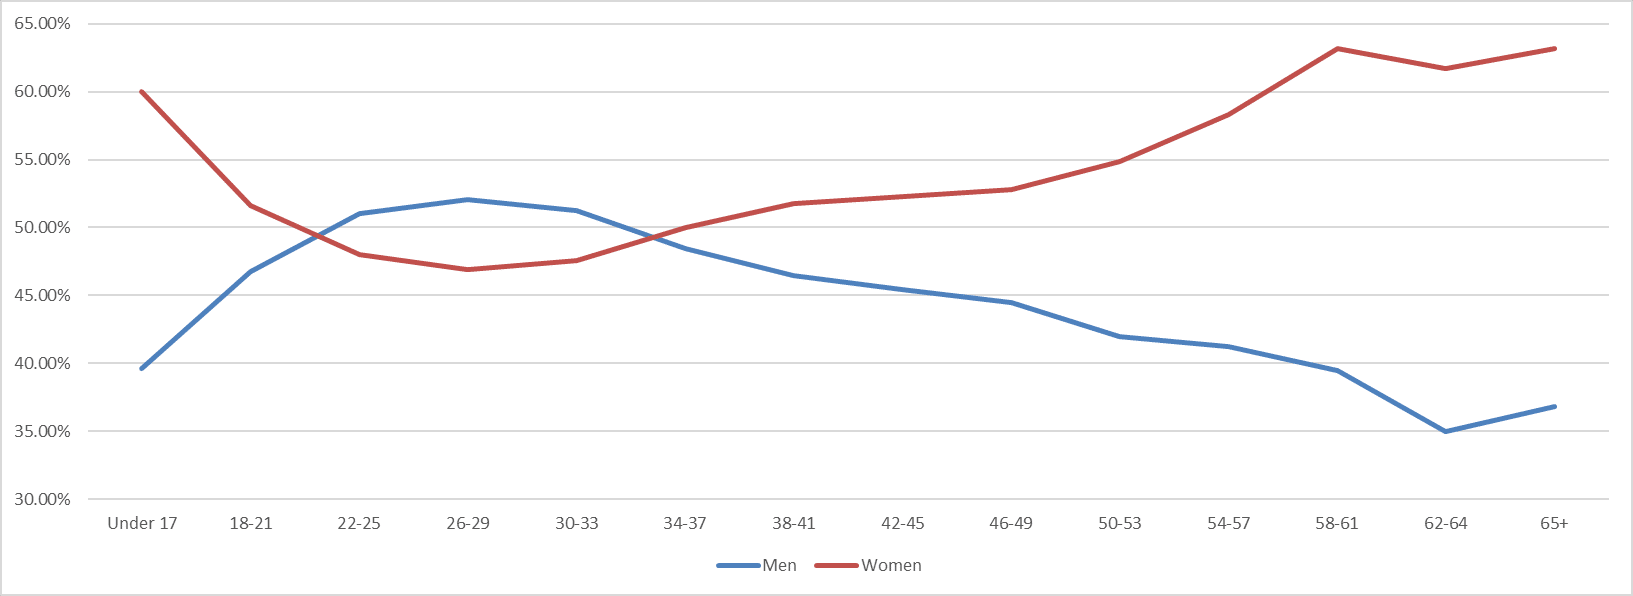
As we can see by the numbers below, women do slip as the majority from around age 22 to 33.
Relationship Status
The relationship status is one I’ve been intrigued to see how it’s changed over the 2 years since last reported. Would we see a major shift as people age? Would it remain steady? Well, lets find out!
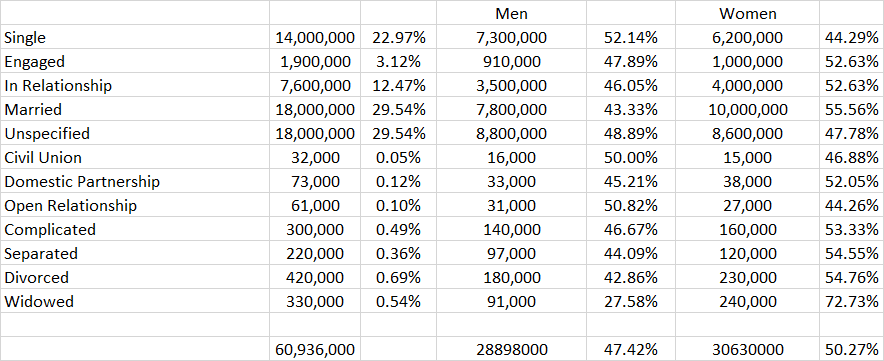
There was a major drop in people reporting their relationship status as it turns out. While the population overall shrunk by about 3 million individuals there were almost 8 million fewer individuals reporting this piece of data.
How has things changed?
- Those who have marked themselves “single” decreased about 3 million
- Those “in a relationship” decreased 1.7 million
- “Married” has remained the same
- “Unspecified” has decreased 3 million
- Other statuses shifted in numbers but their percentages remained mostly unchanged.
Education
Out of all of the statistics, this is the one I’m trying to figure out. Almost all percentages for education level listings are down. This could be due to it just not being as common a thing or there’s been a shift in the populace. The only percentage to increase are those “in high school”.

NEW – Political Leaning
Facebook is a data trove of political information. While I regularly tracked the information, I have never reported on the political leanings of the comic fans there. Well, here’s the first such release of the data!
First up, what does this data look like for Facebook as a whole?
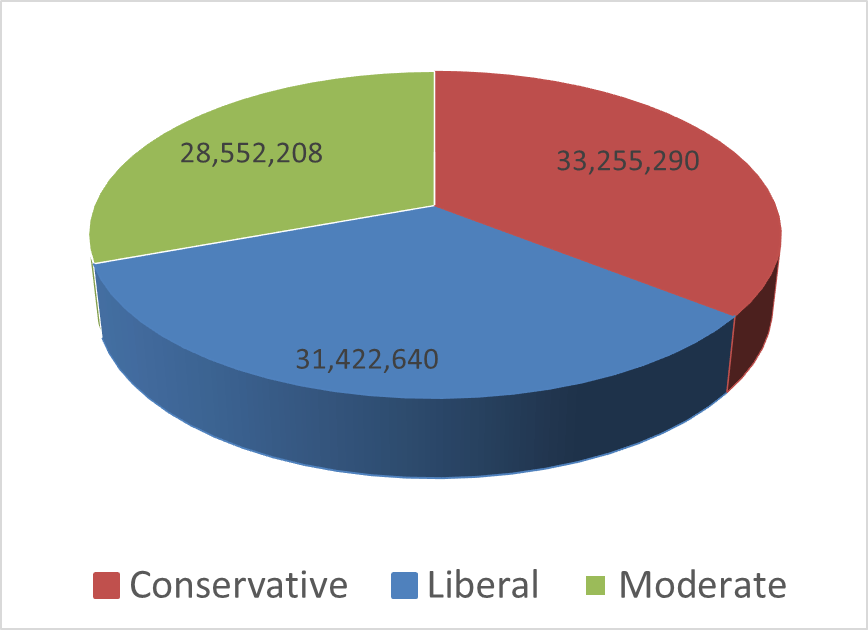
Interestingly, Facebook leans a bit more Conservative with that population making up the largest block of users. Comic fans though are a bit different. Those identified as Liberal make up the majority
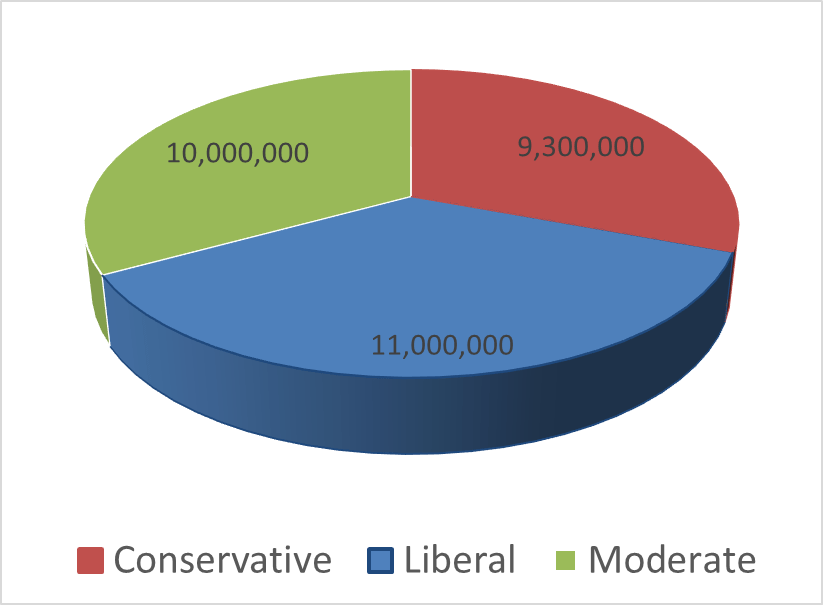
But what about the gender of those comic fans?
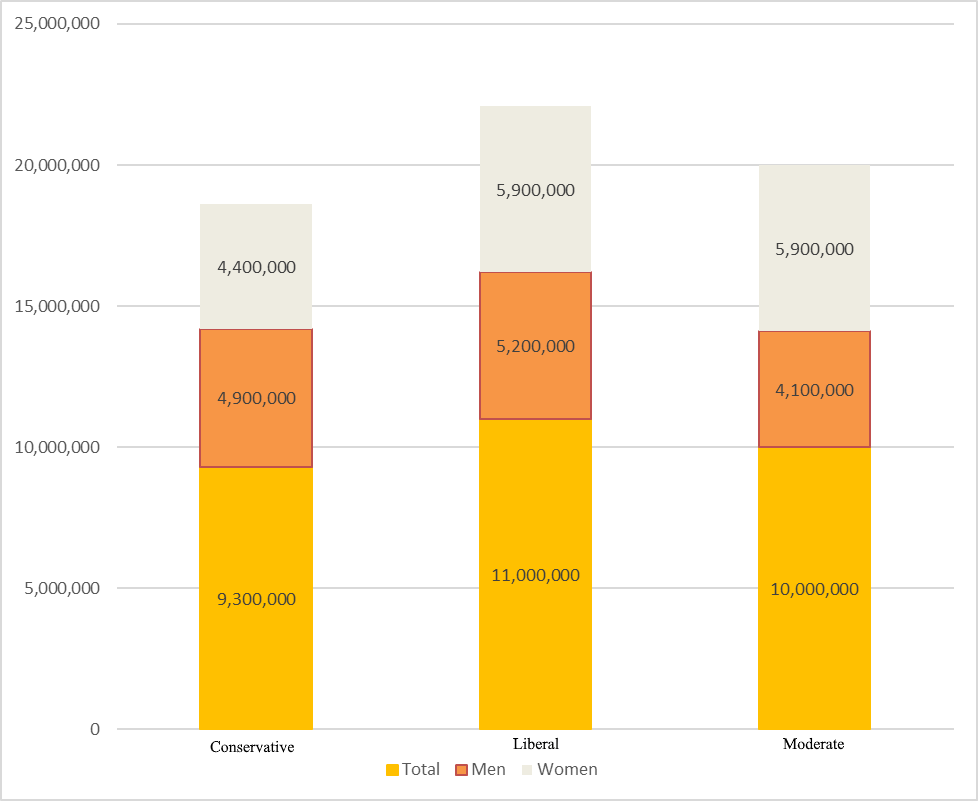
We can see, according to this data that comic fans lean more liberal than the general Facebook population. There are some interesting differences in that Conservatives are dominated by men while those Liberal and Moderate see women as a majority. We’ll see how this shifts over the months and years with the flow of American politics.
That’s it! Or, not… we’ll be back tomorrow as we see the European statistics and then Thursday we dive in comparing the two!
Discover more from Graphic Policy
Subscribe to get the latest posts sent to your email.