
Demo-Graphics: Facebook US Users
Were continuing our year look at demographics of the comic industry and while we focus on comics, we need to see how Facebook has changed to better understand what has happened. It’s been a year since I last looked at the data, and much has changed.
We’ll also be using this data to see how things might impact the comic fan population, and how comic fans compare to the general Facebook population.
Unlike my other reports, this one focuses just on people who are on Facebook and located in the United States. No terms are used at all as far as likes, interests, etc.
Facebook Population: Over 240,000,000 in the United States
Since July of 2017, the population of Facebook users has increased by 9 million individuals. That’s much slower than the 33 million growth from 2016 into 2017. Of that, Spanish speakers now account for 13.33% with 32 million individuals. That’s down from 2017 which was 33 million or 14.29%.
Gender and Age
In 2014, men accounted for 45.56% and women were 53.33%. In 2015 it was 53.40% women and 46.07% men. In 2016 women accounted for 54.04% while men accounted for 45.45%. In 2017 women dipped to 52.38% while men account for 45.89%. In 2018 women continued to decrease in percent of population with 50% while men remained relatively steady with 45.83%.
In the United States as a whole, women account for 51%, while men are about 49%, that was as of the 2010 Census. So, Facebook skewers slightly less female.

We’ll next look at how the percentage of women and men break down through age. Men have become a majority from ages 26-29, the same as last year and there’s also more age ranges where the two demographics split 50/50.

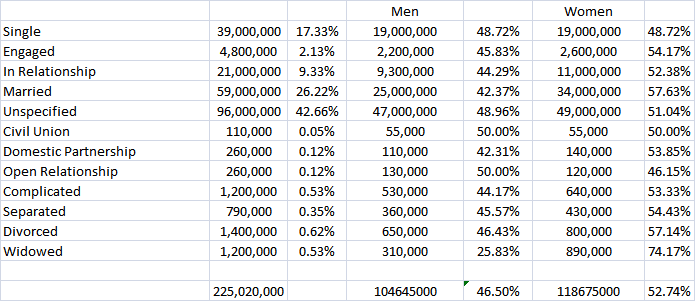
Relationship Status
While the overall population increased, it doesn’t mean all of the below has. Many of the various groups have actually dipped from the previous year other than those “unspecified” which increased by 4 million.
Education
Much like relationships, even though the overall population increased it doesn’t mean that each of these groupings have. While there’s some, overall, it’s mixed like the above.
![]()
Ethnicity
The African American population increased since last year by about 4 million individuals and 1.15 percentage points. Asian Americans increased by 500,000 and 0.53 percentage points. Hispanics increased by 6 million and 1.96 percentage points.

Now that we know where Facebook as a whole stands, we’ll explore more specifics! Join us tomorrow when we start to dive into specific stats, up first DC Entertainment!
Discover more from Graphic Policy
Subscribe to get the latest posts sent to your email.