
Demo-Graphics: The State of DC Entertainment
We’ve kicked off our yearly review of comic fandom demographics! We’ve already posted Facebook‘s general stats, and tomorrow will be Marvel, followed by Indie comics, and the industry as a whole. Up now is DC Entertainment.
This statistic breakdown, we’ve looked at terms like DC Comics and Vertigo Comics, but not specific comic series or characters. It’s a focus on DC Entertainment and its publishing imprints. Think of it as looking at the DC brand.
Facebook DC Comics Fan Population: Over 28,000,000 US
In the year since we’ve run these stats, the population has grown 5 million. In 2017 it stood at 23 million and 2016 it was 11 million individuals. In 2015 it was 12 million and in 2014 it was 7.6 million.
In 2014 Spanish speakers accounted for 14.55%, 2015 it was 14.17%, in 2016 it was 18.18%. 2017 the group shrunk to 12.86% but the population grew 1.6 million to 3.6 million individuals.
Gender and Age
In 2014, men accounted for 68.18% and women were 28.64% of the DC population. In 2015 men accounted for 73.33% and women were 27.50%. In 2016 56.36% of the population was male and 40% female. in 2017 it was women for 47.83% and men 52.17%.
In the year since, women are now 53.57% and men 46.43%, this follows the trend we’ve seen for the last ten months of women being the majority of comic fans
And here’s the stats in a handy pie-chart.

Unlike last year, men are at no point a majority. In facet women are over 60% of the fans under the age of 18. While we might not know why, there’s a chance DC Superhero Girls have helped grow that segment.

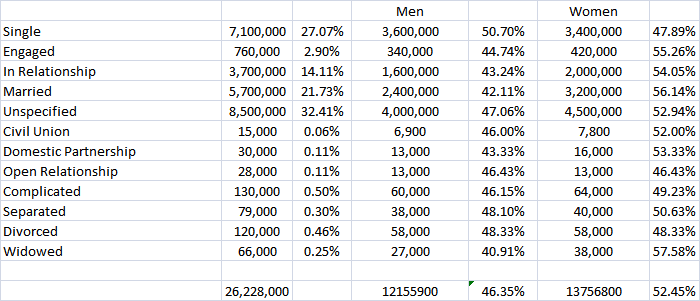
Relationship Status
The overall population has increased and so have most of the below. Those that haven’t have seen no change. There are some individual genders that have decreased though. Single men is an example and that decreased 200,000 while the overall population of that demographic grew 400,000.
Education
Much like the above, some increased and some decreased for specific genders.
![]()
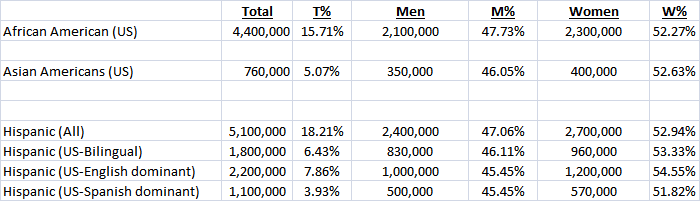
Ethnicity
Every ethnicity has grown since last year. African American fans increased by 1.2 million. Asian Americans saw an increase of 110,000. Hispanics saw an increase of 1.1 million with each sub-group increasing as well.
Come back tomorrow when we’ll look at stats for Marvel!


