Category Archives: Marketing Monday

Demo-Graphics: The Walking Dead

Its been about 6 months since we last looked at The Walking Dead‘s demographics via Facebook’s data. With the season wrapping up and a new season of Fear the Walking Dead beginning, it felt like an appropriate time to see how things have changed for the show and best selling comic book series.

For this report, we’re looking at fans within the United States that enjoy The Walking Dead in comics, television, books, games, or even the characters. We’ll also compare the latest results to those of last report.

Facebook Population: Over 17 million fans in the US

In the six months since the last report the fandom population has decreased by 5 million individuals. That’s after the previous growth of 2 million and two reports ago saw a decrease of 4 million individuals. Spanish speakers account for 2.1 million fans, 12.35%. That’s a decrease of 1.2 million Spanish speakers and decrease in the percentage of the population.
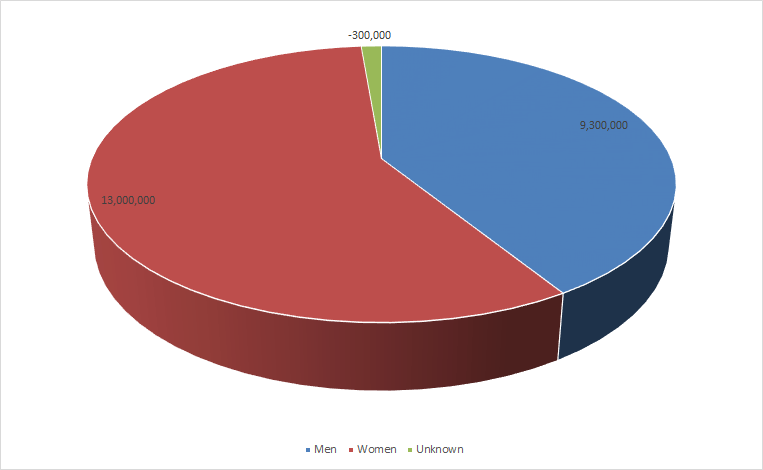
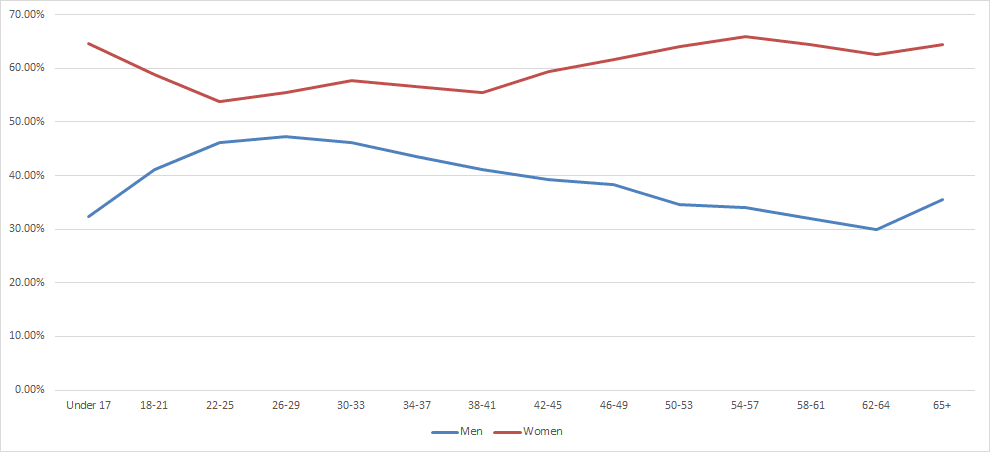
Gender and Age

A year and a half ago women accounted for 55% and men 46% (with the result being over 100% due to rounding). In the previous report, women accounted for 59.09% with men accounting for 42.47%. Again, that was over 100% due to rounding.

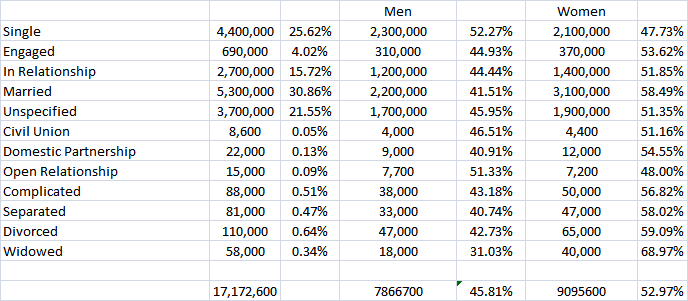
For this latest report, women account for 53.53% and men 45.88%. When looking at age data, women account for 52.65% and men 46.89%. When it comes to relationships, it’s 52.97% female and 45.81% male. Women continue to be the majority.

Men return to being a majority, if just for a small amount. They become the majority in the 22-25 demographic and it’s a 50/50 split at 30-33.
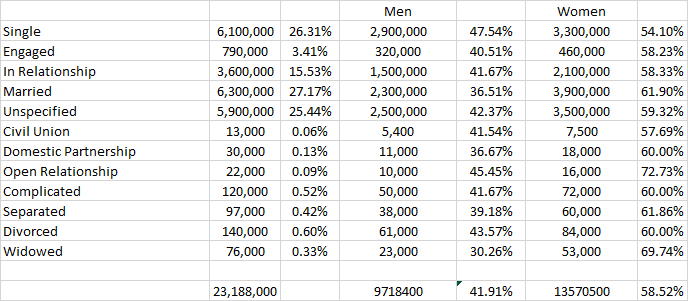
Relationship Status

Things have dropped across the board with “single” and “unspecified” both seeing big drops as far as percentage.

Education

And of course with a smaller population, education has dipped too. Women are no longer the majority at every education level.

Gender Interest

Due to changes with Facebook policy, we’re unable to still provide this data.
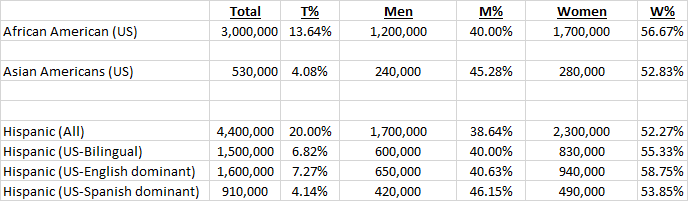
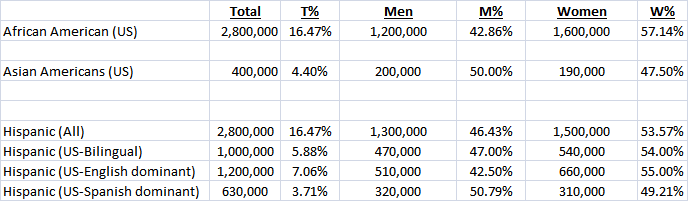
Ethnicity

With a smaller population, it shouldn’t be surprising that the raw numbers have dropped. But, African Americans increased almost 3 percentage points and Asian Americans almost a half a percent. Hispanics dropped about 3.5 percentage points.

Specific Terms

But what about specific terms? Interesting enough, the majority of fans are in the United States for the comic series and Talking Dead. The latter makes sense. The rest vary in how many are in the US though most are in the 20-45% range. When it comes to gender, only those interested in video games are majority male.

And that wraps up this report! We’ll again look at these numbers when Fear the Walking Dead wraps up!


Demo-Graphics: The Walking Dead

Its been about 10 months since we last looked at The Walking Dead‘s demographics via Facebook’s data. With the eighth season debut, it felt like an appropriate time to see how things have changed for the record setting show, and best selling comic book series.

For this report, we’re looking at fans within the United States that enjoy The Walking Dead in comics, television, books, games, or even the characters. We’ll also compare the latest results to those of last report.

Facebook Population: Over 22 million fans in the US

In the ten months since the last report the fandom population has grown by about 2 million individuals. The previous report saw a decrease of 4 million individuals so things have begun to recover to what they were, though not all the way there yet. Spanish speakers account for 3.3 million fans, 15.%. That’s a decrease of 200,000 Spanish speakers and decrease in the percentage of the population.

Gender and Age

A year ago women accounting for 55% and men 46% (with the result being over 100% due to rounding). Women have made the most gains now accounting for 59.09% with men accounting for 42.47%. Again, that’s over 100% due to rounding. When looking at the breakdown by age, women account for 57.9% and when looking at the data based on their “relationship status” they account for 58.5%. No matter how you cut it, women have seen greater growth over the months.

The graph below which shows age and gender has shifted since last year. Men no longer are a majority at any point where as before they became a majority from age 18 to 33.

Relationship Status

When it comes to their relationships, those listed as “single” saw the second highest gain with 800,000 individuals. Those listing “unspecified” saw the biggest gains with 1.8 million individuals. “In relationship” increased by 500,000, while “married” saw no change. Even with the slight gain in overall population men remained steady with “single,” “engaged,” and “civil union.” Men listing “married” decreased by 200,000. Women saw gains across the board except for “divorced” which saw a decrease of 2,000 individuals.

Education

Big changes when it comes to education. Women are now a majority in at every education level.

Gender Interest

Men and women interested in the same gender both increased as far as total. “Women interested in women” decreased as far as percentage. When it comes to men interested in “men and women,” that decreased both in total and percent though women interested in “men and women” saw gains in both.

Ethnicity

African Americans, Asian Americans, and Hispanics all saw gains compared to the last report, though those gains didn’t keep up with the overall population increase. Interestingly Hispanics listed as bilingual decreased by 600,000 while “English dominant” increased by 830,000 and “Spanish dominant” decreased by 490,000.

And that wraps up this report! We’ll again look at these numbers during the fall break and when this season wraps up!


Demo-Graphics: The Walking Dead

Its been about 8 months since we last looked at The Walking Dead‘s demographics via Facebook’s data. With the seventh season’s mid-season break, it felt like an appropriate time to see how things have changed for the record setting show, and best selling comic book series.

For this report, we’re looking at fans within the United States that enjoy The Walking Dead in comics, television, books, games, or even the characters. We’ll also compare the latest results to those of last report.

Facebook Population: Over 20 million fans in the US

That’s a decrease of 4 million individuals from 8 months ago. Spanish speakers account for 3.5 million fans, 17.5%. That’s a decrease of 500,000 Spanish speakers but an increase as far as percentage of the population.

Gender and Age

A year ago women accounting for 54.17% and men 45.83%. Women continue to gain now accounting for 55% while men are 46%. The reason it’s over 100% is that when numbers are this large they’re often rounded in some way.

walking-dead-facebook-gender-12-12-16

The graph below is similar to last year but a big difference is that women under 17 are a much greater percentage of their age group.

walking-dead-facebook-gender-age-12-12-16

Relationship Status

Compared to last year, those that are “single” saw a pretty big drop, but there was also a loss of those “married,” though that gained as far as percentage.

walking-dead-facebook-relationship-12-12-16

Education

There’s some slight shifts as far as education. Higher education when it comes to graduate degrees and in college are both dominated by women.

walking-dead-facebook-education-12-12-16

Gender Interest

Men and women interested in the same gender both increased as far as percentages but those interested in men and women saw a decrease.

walking-dead-facebook-gender-interest-12-12-16

Ethnicity

African Americans saw a large increase compared to last report. Asian Americans also saw a slight increase. Hispanics saw big decrease primarily due to a decrease in English dominant and Spanish dominant.

walking-dead-facebook-ethnicity-12-12-16

Generation

And finally, as expected, overall stats dropped. Baby Boomers and Generation X both increased as far as percentage.

walking-dead-facebook-ethniciy-12-12-16

And that wraps up this report. Come back on the 15th where we’ll have a new demographics breakdown of individuals in Europe.


Demo-Graphics: The Walking Dead vs. Fear the Walking Dead

Over the past two weeks I’ve been exploring the demographics of those who “like” The Walking Dead and Fear the Walking Dead on Facebook. While there’s much that’s similar between the two, they each have their own fandom. For these types of reports, I look at those who like terms associated with each show.

The Walking Dead has over 24 million fans in the United States, and Fear the Walking Dead‘s 1.4 million fans is a subset. In other words, those who like Fear the Walking Dead also like The Walking Dead.

Lets dive in to see where they are similar and where they differ.

Gender and Age

When it comes to gender, both shows enjoy a majority made up of women when it comes to their gender split with The Walking Dead having a bit of an edge in that department. The Walking Dead has 54.17% female fans while Fear the Walking Dead is 52.86%.

The Walking Dead Gender

wd gender 4.4.16Fear the Walking Dead Gender

fear the walking dead gender 4.11.16What’s also interesting between the two is that each show has women as the majority of fans age 17 and under, then men take over as the majority from age 18 to age 33, then it’s women again.

Relationship Status

Here we start to see some bigger differences between the two. Fear the Walking Dead fans have a higher percentage that are “married,” “in relationship,” “domestic partnership,” and “engaged.” With the show being geared around families, more so than Walking Dead, you have to wonder if that plays into it at all?

Fear the Walking Dead Relationship Stats

fear the walking dead relationship status 4.11.16Gender Interest

This one I find a bit interesting. Fear the Walking Dead has a higher percentage of folks interested in the same sex, though there’s a smaller interest of people interested in both sexes.

Fear the Walking Dead Gender Interest

fear the walking dead gender interest 4.11.16The Walking Dead Gender Interest

wd gender interest 4.4.16Ethnicity

This one I’m a bit surprised about. Fear the Walking Dead has a higher percentage of African American fans, but fewer Hispanic fans (not something I’d have expected). The one exception is there is a higher percentage of Hispanics who are English-dominant for Fear the Walking Dead fans.

The Walking Dead Ethnicity

wd ethnicity 4.4.16Fear the Walking Dead Ethnicity

fear the walking dead ethnicity 4.11.16While the differences are huge, there are some subtle ones. It’ll be interesting to see as Fear the Walking Dead‘s fandom grows to see if the differences between the demographics of the two shows expands too.

Demo-Graphics: Fear The Walking Dead

Last week we looked at the demographics for The Walking Dead‘ finding that the popular show has about 24 million likes in the United States on Facebook and women account for 54.17% of those likes. This week we’re looking at Fear the Walking Dead, the sister show whose second season debuted this past Sunday.

For this report, we’re looking at fans within the United States that enjoy Fear The Walking Dead just on television, due to the lack of other terms.

Facebook Population: Over 1.4 million fans in the US

Spanish speakers account for 170,000 fans, 12.14%.

Gender and Age

Much like The Walking Dead, women are the majority of the likes for Fear the Walking Dead. Women account for 52.86% with 740,000 individuals and men are 49.29% with 690,000 individuals. The total is over 100% due to how Facebook rounds the data.

fear the walking dead gender 4.11.16Below is women and men as they age. We see the usual split as they grow older, but where that happens is a bit different than The Walking Dead. Women are still the majority of those under the age of 17.

fear the walking dead gender age 4.11.16Below is the raw data for Fear the Walking Dead fans.

fear the walking dead gender age raw 4.11.16Relationship Status

Some of the populations are just too small to get an accurate number. For those the spaces are blank. Compared to The Walking Dead more individuals are “in a relationship” and “married.”

fear the walking dead relationship status 4.11.16Education

Women are a majority in many of the education break downs which is rather interesting.

fear the walking dead education 4.11.16Gender Interest

Generally men interesting in men and women interested in women are higher than fans of The Walking Dead with the former having a much larger jump.

fear the walking dead gender interest 4.11.16Ethnicity

Though the show has a pretty diverse cast these stats are not what I expected compared to The Walking Dead. African Americans are a higher percentage, but all of the rest are lower with some variation in the Hispanic demographic.

fear the walking dead ethnicity 4.11.16Generation

This data is what I’d expect with the show being more popular with those in the Generation X demographic. Millennials is about the same.

fear the walking dead generation 4.11.16And that wraps up the latest look at the demographics of those who like Fear the Walking Dead. Next week we’ll compare the show with The Walking Dead!

Demo-Graphics: The Walking Dead

Its been about a  year since we last looked at The Walking Dead‘s demographics via Facebook’s data. With the sixth season wrapped up, it felt like an appropriate time to see how things have changed for the record setting show, and best selling comic book series.

For this report, we’re looking at fans within the United States that enjoy The Walking Dead in comics, television, books, games, or even the characters. We’ll also compare the latest results to those of last report.

Facebook Population: Over 24 million fans in the US

That’s an increase of about 2 million fans since last year. Spanish speakers account for 4 million fans, 16.67%. That’s an increase of 1 million Spanish speakers.

Gender and Age

A year ago, men and women were generally evenly split with women accounting for 51.82% and men for 50.91% (yes it’s more than 100%, but the system most likely rounds up for large numbers). A year later and women have surged with the 2 million increase almost entirely in that demographic. Women account for 13 million likes while men account for 11 million. That’s 54.17% women and 45.83% men.
wd gender 4.4.16Below is the trend line which looks at the age and gender of the individuals together. I think what’s interesting is this data is comparable to last year where women are a majority under the age of 17, then men are a majority for a bit, then women become the majority much earlier than comic book likes of the general Facebook population.

wd gender age 4.4.16Below is the raw data for The Walking Dead fans.

wd raw data 4.4. 16Relationship Status

Compared to last year, the relationship status is almost the same. The only major shit is more individuals are “unspecified” and that mostly comes from “in a relationship” and “engaged.”

wd relationship status 4.4.16Education

Like relationships, education has remained relatively the same as last year.
wd education 4.4.16Gender Interest

With more women the amount of women interesting in men has seen the most shift, but what’s also interesting is while there’s fewer men interested in men and women interested in women, there are more men and women interested in men and women.
wd gender interest 4.4.16Ethnicity

The last report was the first to track ethnicity and since then African Americans and Asian Americans have both increased slightly while Hispanics, particularly bilingual and Spanish dominant, have increased greatly.
wd ethnicity 4.4.16

Generation

And finally, compared to last year’s report, Baby Boomers and Generation X have both decreased in population size while Millennials make up almost 2/3 the population increasing in both raw numbers and as a percent.

wd generation 4.4.16And that wraps up the latest look at the demographics of those who like The Walking Dead on Facebook. Next week, Fear the Walking Dead!

Demo-Graphics: The State of “Gamers” 2015

It’s Monday and we’re looking at the latest Facebook Fandom breakdown. It’s been a year since I did a report about “gamers” in the lead up to Gen Con. So, welcome to the second annual State of Gamers.

This data is gained through mining Facebook and includes over 175 different terms from a variety of games, publishers, and more. The terms I used are varied, and many, from the name of games to the name of publishers and terms like collectible card game. For this I did my best to stay away from generic terms for genres (like Fantasy) and terms that specifically mentioned video games. I also avoided games like Monopoly or Scategories, I wanted to focus on the games you’d find at Gen Con.

We’ll compare this report to last year’s, but much has changed since then. Unlike the previous year, the technology platform to get the data has remained mostly unchanged, and the terms used also remain relatively the same (some have gone away, some are new).

Facebook Population: Over 31,000,000 in the United States

The amount of individuals who like these terms has increased from the previous year by 7 million.

Spanish speakers account for now 3.9 million fans, 12.58% in the United States. That’s an increase of 1.3 million since last year.

Gender and Age

In 2014 Men dominated as the majority with 55% compared to women at 44.17%. A year later and things have changed. Men now account for just 51.61% and women are 48.39%.

gamers facebook gender 7.27.15

We’ll next look at how the percentage of women and men break down through age.

gamers facebook gender age 7.27.15

Compared to last year, the graph above is very similar though the gap between men and women is less. What I do find interesting is that women really start to gain in population in the 26-29 segment, and the majority at 38-41. It would seem that women may come into board games later in life.

gamers facebook gender age raw 7.27.15

Relationship Status

The real shift from last year is that a greater percentage are married or unspecified compared to last year.

gamers facebook relationship status 7.27.15

And for those that like pie charts.gamers facebook relationship status pie chart 7.27.15


Education

The education stats haven’t shifted much since last year, even with the surge of new folks.

gamers facebook education 7.27.15

Gender Interest

Those interested in the same gender has decreased percentage wise since last year, but the population has increased.

gamers facebook gender interest 7.27.15

Ethnicity

This is a new data that wasn’t available last year. Below the data is presented without comparison due to that. I can say that the data is interesting compared to the general United States population. Both the African American and Asian American population are a smaller percentage compared to the general US population, but the Hispanic population is much greater.

gamers facebook ethnicity 7.27.15

Generation

Below are the stats of groups based off of their generation, another new statistic.

gamers facebook generation 7.27.15

And that wraps up our look at who the gamers are in the United States!

We’ll be returning with a new demographic break down of comic book fans this Saturday August 1!

What Does Facebook Tell Us about Pitch Perfect 2 and Mad Max?

pitch-perfect-2-pp2_rgbThis past weekend at the box-office was a triumph for women, and a blow to misogyny. Pitch Perfect 2 ruled the weekend earning $70.3 million domestically while Mad Max: Fury Road earned $44.44 million. The two films helped make it a record breaking weekend, but also had two films that had kick-ass women in it.

Pitch Perfect 2 was especially impressive earning about 5.5x the original film’s opening weekend. But should that have been a surprise? The original film found a huge audience after its initial theatrical run.

About 72% of the audience for Pitch Perfect 2 was female, and 57% was younger than 25. Mad Max: Fury Road was 60% male and 64% older than 25. While 51% of the population is female, 52% of moviegoers are women according to the MPAA.

Facebook shows us these general trends, the Pitch Perfect series has many more female fans while Mad Max skews more male. Both performed better than their stats though in their “opposite” gender of the majority of fans. More men attending Pitch Perfect 2, and more women attended Mad Max. That could account for their dual solid openings, as each gender brought the other to the cinema. Each fan page also does better in their weaker gender than previous films in the series.

No matter the why, each film shows that women shouldn’t be discounted when it comes to the cinema.

Pitch Perfect 2 Mad Max Stats

Demo-Graphics: The Walking Dead

Its been about five months since we last looked at The Walking Dead‘s demographics via Facebook’s data. With the new season underway, it felt like an appropriate time to see how things have changed for the record setting show, and best selling comic book series.

For this report, we’re looking at fans within the United States that enjoy The Walking Dead in comics, television, books, games, or even the characters. We’ll also compare the latest results to those of last report.

Facebook Population: Over 22 million fans in the US

That’s an increase of about 4.2 million fans since last year. Spanish speakers account for 3 million fans, 13.64%. That’s over the double amount of individuals since October.

Gender and Age

In October we saw a surge of female fans compared to the stats from 2013. Women account for 47.19% and men were 52.81%. Five months later, and women continue to grow in fans so that men and women are split even. Due to the rounding of numbers when dealing with these large number, men account for 50.91% and women 51.82%. Looking at the relationship status which pegs the universe at 22.8 million, women account for 50.01% of fans while men are 49.27%. The gender of the fans is split evenly.

wd gender 3.30.15Below is the trend line which looks at the age and gender of the individuals together.

wd age and gender 3.30.15Below is the raw data for The Walking Dead fans. The population has shifted slightly older compared to last year.

wd age and gender raw 3.30.15

Relationship Status

The biggest shift compared to October is those married who now account for a little over 30% compared to 24% then.

wd relationship 3.30.15And for those that like pie charts.

wd relationship pie chart 3.30.15

Education

Like relationships, education has changed a lot since last year, so we can’t really compare this year’s stats to last year’s.

wd education 3.30.15Gender Interest

Gender interest too has changed since last year. The biggest change is those who are unspecified, which rose across the board.

wd gender interest 3.30.15Ethnicity

This is also the first report where ethnicity is tracked for The Walking Dead. Interestingly African American women are a majority of fans for African Americans.

wd ethnicity 3.30.15Generation

When it comes to generational labels women account for a vast majorty of those interested in The Walking Dead for Baby Boomers and Generation X. It shouldn’t be surprising considering how the genders shift as the population ages.

wd generation 3.30.15

And that wraps up the latest edition of the Facebook Fandom Spotlight.

Black (Comic) History Month: Demo-Graphics, African Americans & Comic Publishers

For Black History Month we’ve been taking a look at characters, series, and creators, but I thought it also might be nice to also look at some of the demographic data that exists. The first thing I wanted to see was if African-American comic fans varied as to what publisher they liked.

For this demographic report I again dove into Facebook using the data provided as per usual. In February, African-Americans accounted for 3.4 million of the 32 million “comic fans,” making them 10.63% of the population. In general on Facebook, African-Americans make up 11.24% of the Facebook population.

I decided to look at not just publishers, but “comics” and “manga” as well to see what the percentage of African-Americans like them as well as how it breaks down as far as men and women.

In general for all of the terms below African-Americans account for 10.83% of that population. Marvel, DC Comics, Dark Horse, Dynamite, and in general comics underperform that percentage. Image, IDW, BOOM!, Oni, and Manga outperform. BOOM! and Oni especially do well having the top two percentages.

When it comes to percentage, men and women are the closest for Image, Comics and Manga. The biggest difference between men and women is Dark Horse.

AA Comic Data 2.9.15This is just the first report! I’ve got two more Mondays to dive even deeper into the information.

« Older Entries