
Demo-Graphics: Comic Fandom Remains Relatively Steady in November
Demo-Graphics is back with its seventh entry for 2025 (plus some bonus features)! Demo-Graphics was relaunched because the question still remains… who are comic fans?
What is Demo-Graphics?
Each month I dive into data from Facebook looking at the various demographics it can tell us about comic fans. This isn’t hard numbers, purchasers, or “Wednesday warriors,” but best used to show trends in the industry and the potential of the market out there. This has shown the shift towards women being a major force in readers and a shift to the younger demographic.
How does it work?
We use key terms, “likes”, that users have indicated and have come up with our own set to measure each month. There’s over 50 terms used (and no I won’t release them). We stick to specific terms for the industry such as “comics” and “graphic novels” and “one-shots” as well as publishers and leave out broad terms like specific characters or stories. Just because someone likes Batman doesn’t mean they like comics.
Other things to know…
This data is important in that it shows who the potential comic audience could be. These are not purchasers, these are people who have shown an affinity for comics, are potential purchasers, and those with a clear interest.
Also, with this being online/technology, due to laws and restrictions, those under the age of 13 are underrepresented.
Since the last time this feature was run, Facebook has made adjustments as to what it can report so some data is no longer available and we’ve also added in new data that hasn’t been reported before, and it now presents the data as a wide range. I’ve taken the average of the range. So, if it’s presented as somewhere between 500 and 1,000 people, the number would be 750.
So, let’s kick off the latest entry with the big question…
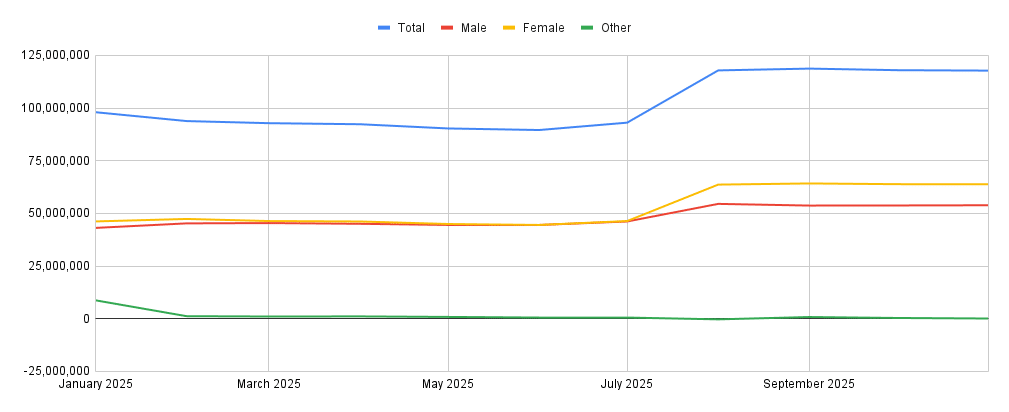
Facebook “Comic Fan” Population: Around 117.75 million in the United States
The first half of 2025 was off to an interesting start as we saw a decrease in the overall population for five months in a row. From January 2025 to June 2025, there was a loss of 8.45 million individuals. But, July stopped the slide with an increase of about 3.5 million individuals. August saw a jump of 24.8 million individuals while Facebook in the United States saw a decrease of about 500,000 individuals. September saw another bump of 850,000 while overall Facebook population increased by 2.2 million. October was a slight decrease in “comic fans” but also in the overall Facebook user population for the US. While November also dipped, it decreased just 200,000 individuals.
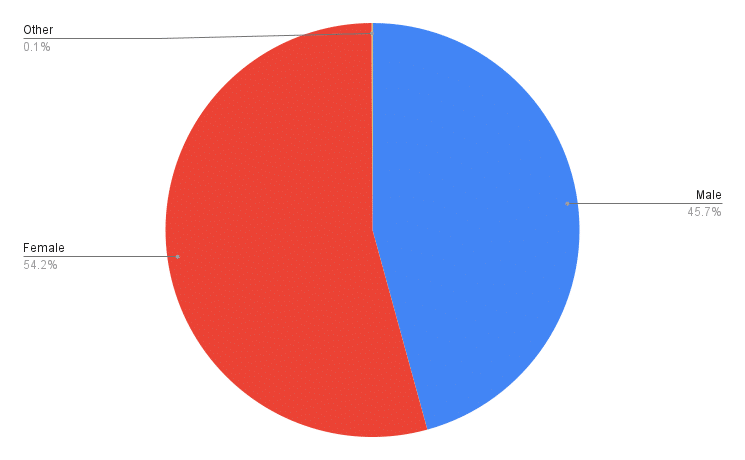
Gender
Over the month, men saw a slight increase of 100,000 whole women dipped by 50,000 and “other” (those not reporting gender) dropped by 250,000.
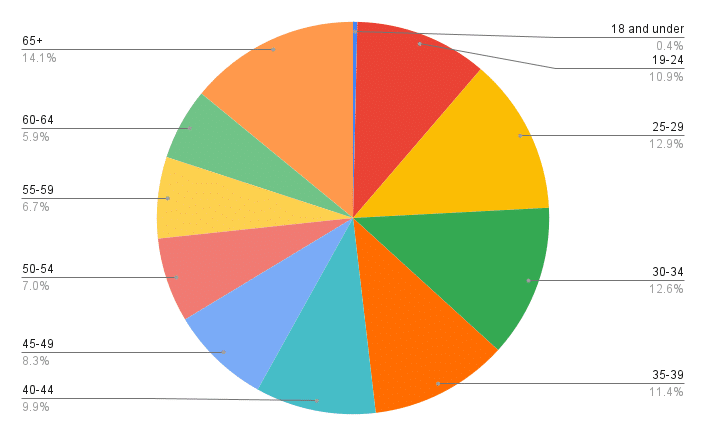
Age
Generally, those aged 25 and up increased in their respective groups with those “30-34” decreasing by 100,000. There was some bigger drops in “18 and under” which saw a decrease of 88,000 and “19-24” which decreased 550,000. There’s been a steady decrease in these groups for three months now. It could be an overall trend with younger individuals leaving Facebook in general or something more.
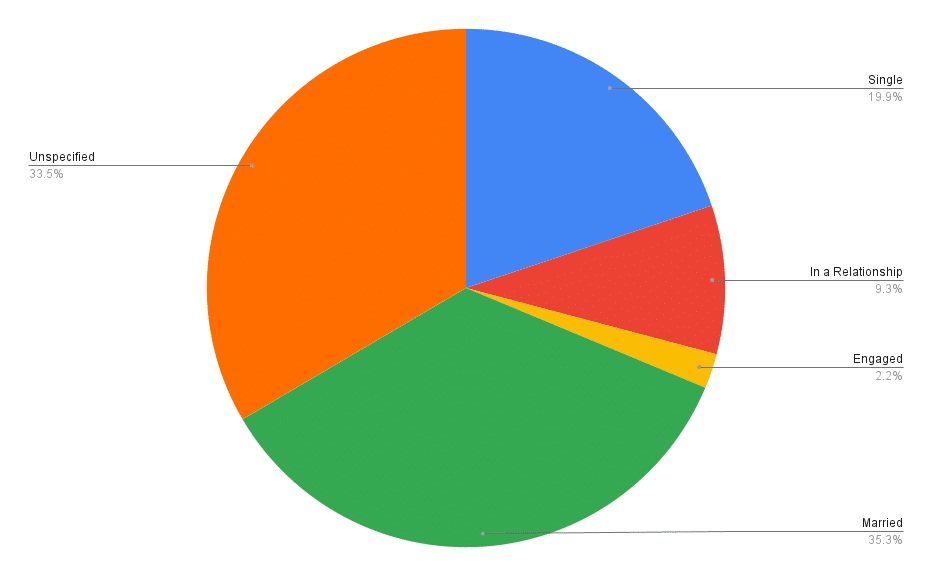
Relationship Status
There were either increases or the population held steady from the previous month. “Single,” “Married,” and “Unspecified” all increased over the month while “In a Relationship,” and “Engaged” both stayed steady.
New Stats!
Education has been combined to see how many individuals have at least a college degree. This month saw an increase in individuals having at least a college degree, 35.6 million. With a smaller overall population, the percentage of the population has increased to 30.23%. In 2024, 31.3% of the American population had at least a college degree.
23.1 million fans are parents! That’s another decrease from the previous month which was 23.4 million. That’s three months in a row this group has decreased in size.
And finally, what’s the crossover with fans of board games and video games? 45.05 million, 38.26% of comic fans also enjoy board/tabletop/card games, a decrease from the previous month. 67.8 million, 57.58% also enjoy video games, an increase from the previous month. Combined, 82.35 million like board games or video games and 29.9 million enjoy board games and video games. Get your licensing engines revving!
What’s Next?
All of this is a re-starting point. Things have shifted in how I’m collecting the data, like age, but it’s been quite a while since I’ve regularly done this. As we move along, we’ll continue to look at trends over time. If we can start getting sales data again, we could see if there is a correlation between these stats and the overall health of the comic market.
Discover more from Graphic Policy
Subscribe to get the latest posts sent to your email.