Category Archives: Features

Demo-Graphics: Tabletop Game Edition – We’re going Worldwide in July

Demo-Graphics has generally focused on the demographics of comic fans but occasionally we have also reported on other fandoms and communities. In August 2025, we kicked off a new regular look at those interested in tabletop games. That includes board games, roleplaying games, and card games. Why? The question still remains… who are the fans of tabletop games?

What is Demo-Graphics?

Each month I dive into data from Facebook looking at the various demographics it can tell us about comic, and now tabletop game, fans. This isn’t hard numbers, purchasers, or “Wednesday warriors,” but best used to show trends in the industry and the potential of the market out there.

How does it work?

We use key terms, “likes”, that users have indicated and have come up with our own set to measure each month. There’s over 50 terms used (and no I won’t release them). We stick to specific terms for the industry such as “board games” and “collectible card games” as well as publishers and leave out broad terms.

Other things to know…

This data is important in that it shows who the potential audience could be. These are not purchasers, these are people who have shown an affinity for tabletop games, are potential purchasers, and those with a clear interest.

Also, with this being online/technology, due to laws and restrictions, those under the age of 13 are underrepresented.

The data that is presented as a wide range. I’ve taken the average of the range. So, if it’s presented as somewhere between 500 and 1,000 people, the number would be 750.

So, let’s kick off the first entry with the big question…

Facebook “Tabletop Gamer” Population: Around 605.6 million worldwide

In the United States 27.78% of individuals on Facebook indicate they’re also interested in tabletop games. Worldwide, that number decreases to 17.67%, 605.6 million individuals out of the 3.428 billion on Facebook. In the future, we may see how easy it is to see how those numbers break down per country.

Gender

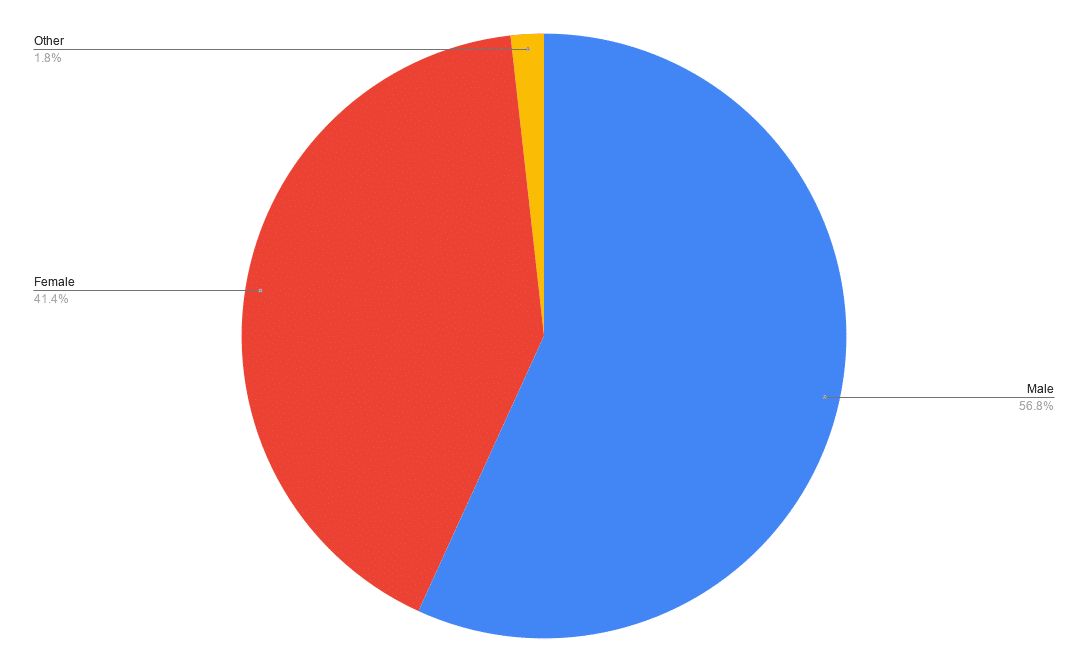
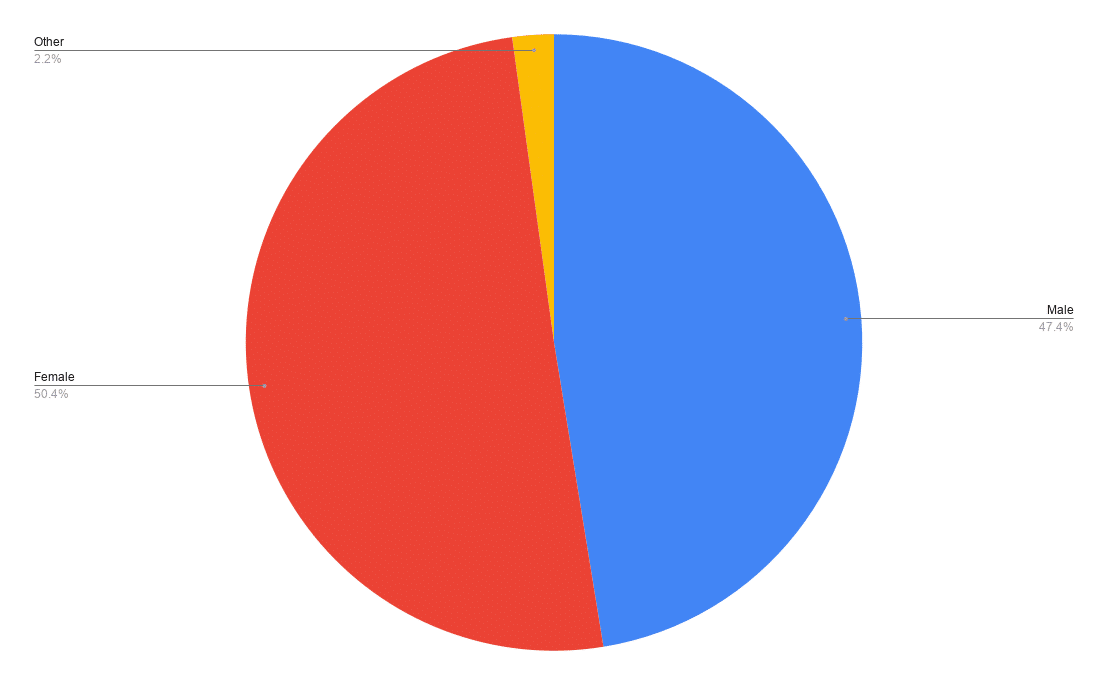
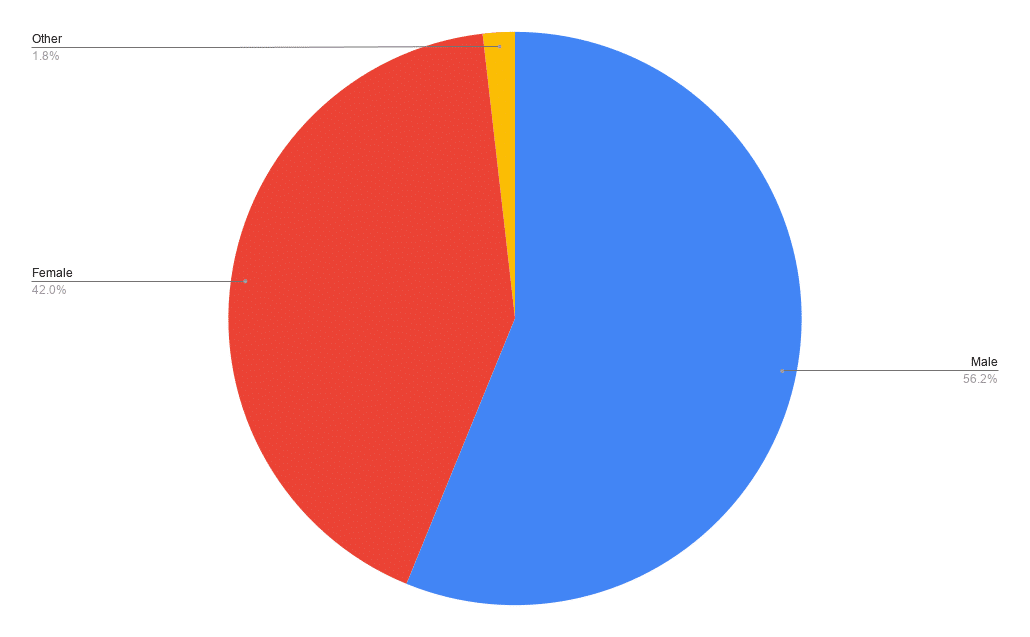
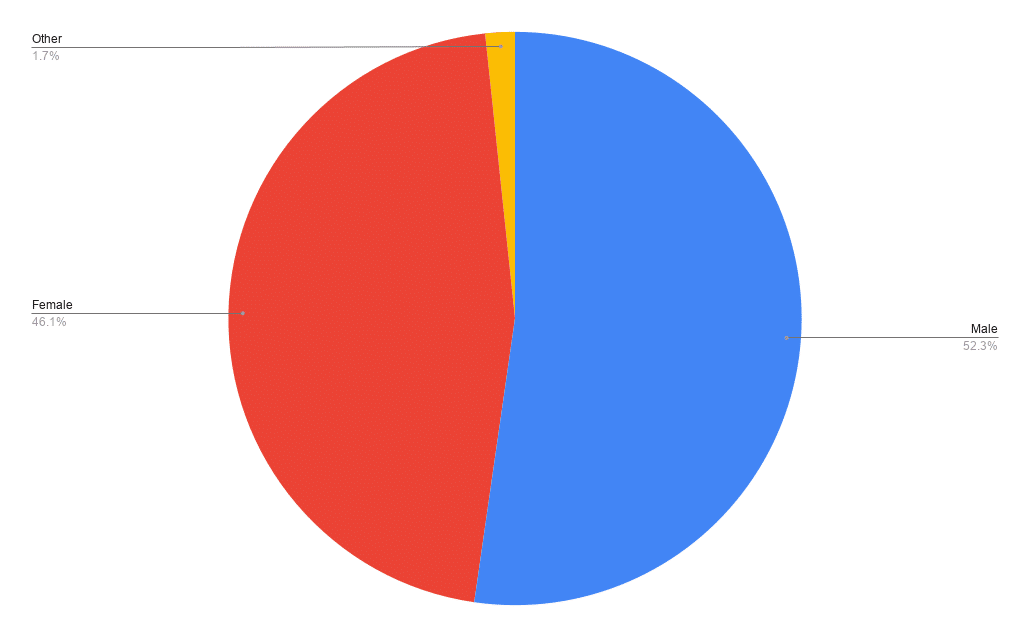
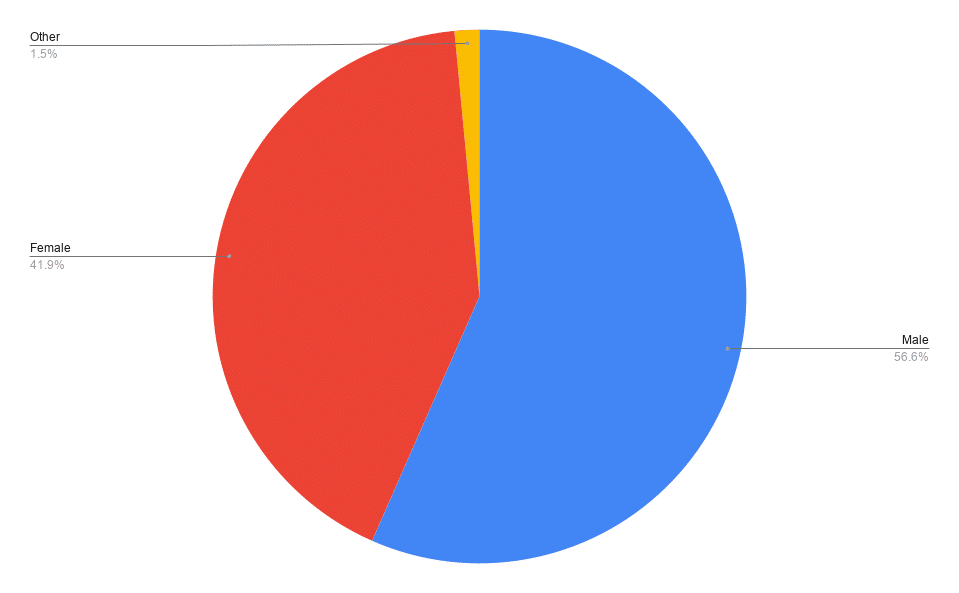
Men are a majority, far more so than in the United States. While in the US, the gender difference is a few percentage points, worldwide it’s almost 15 percentage points. Men account for 56.59% of the population with women making up 41.91% and those not reported as either are 1.5%.

Worldwide gender breakdown for tabletop games in July 2026

Age

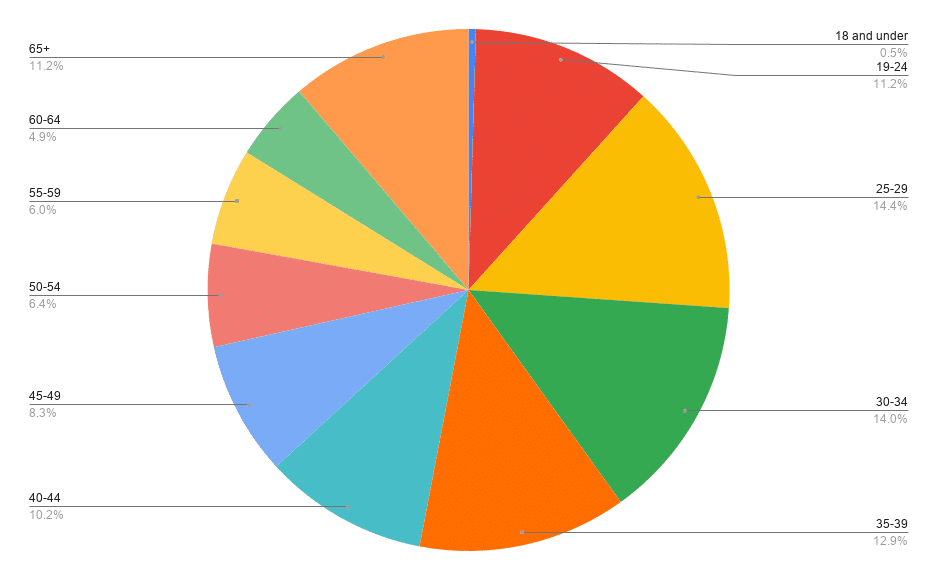
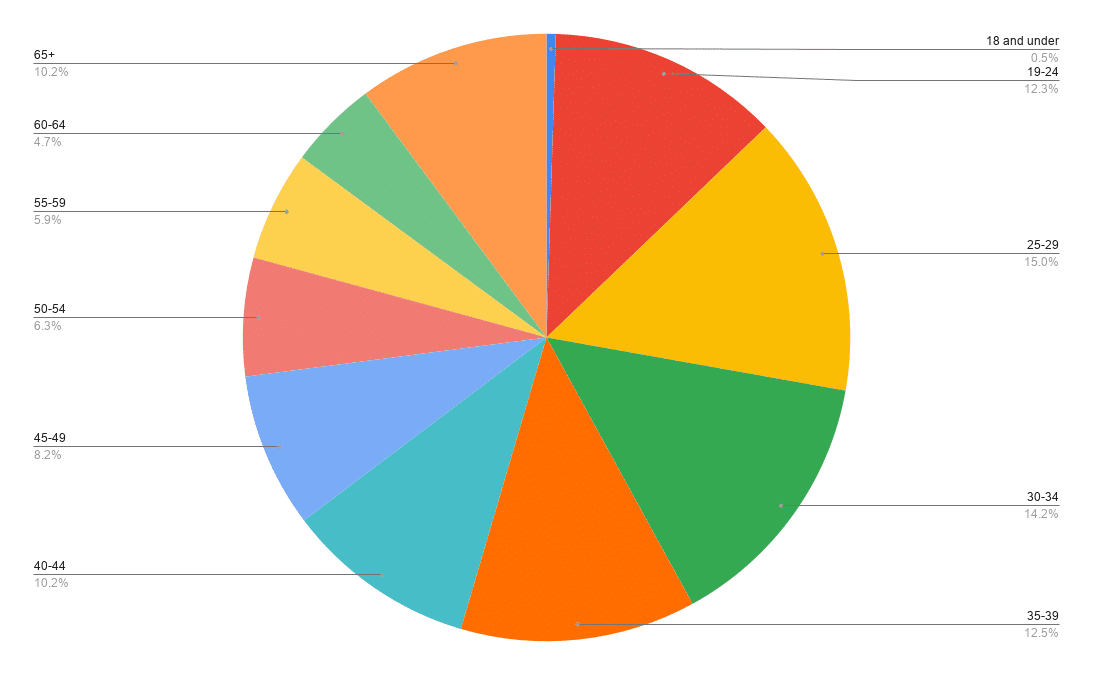
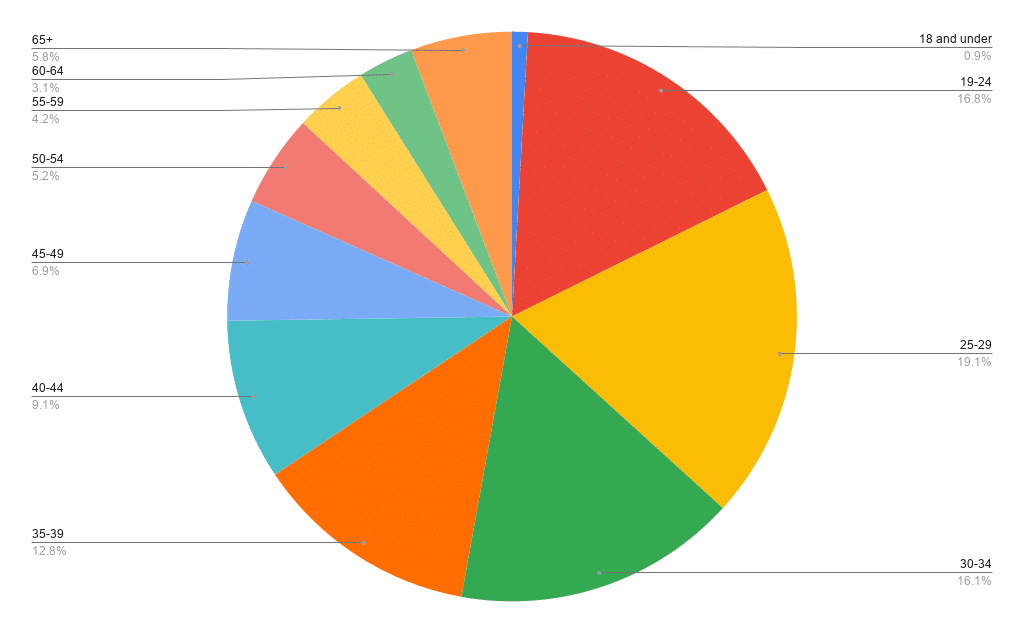
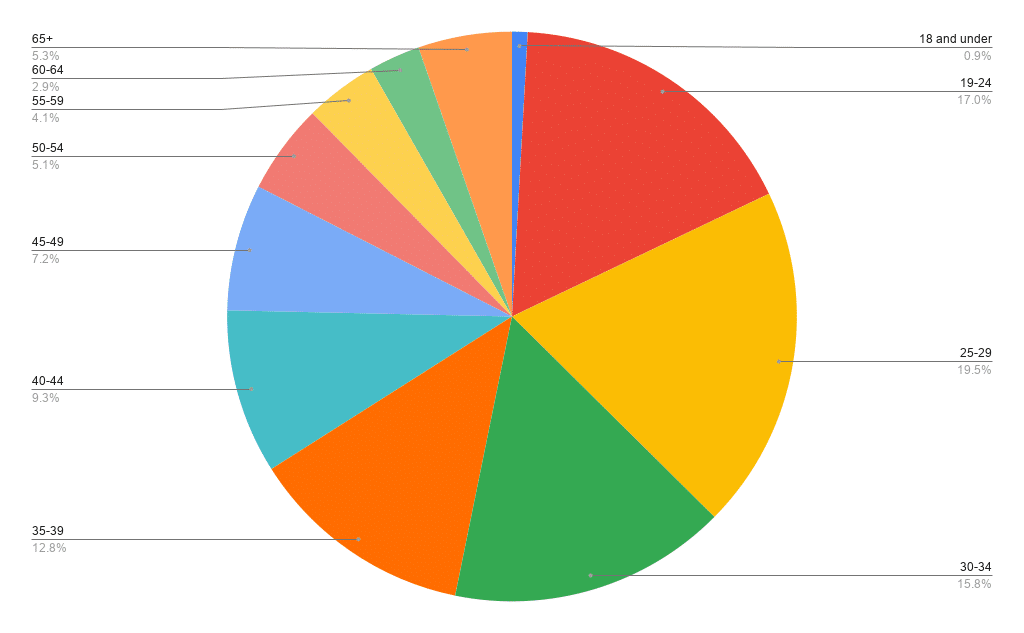
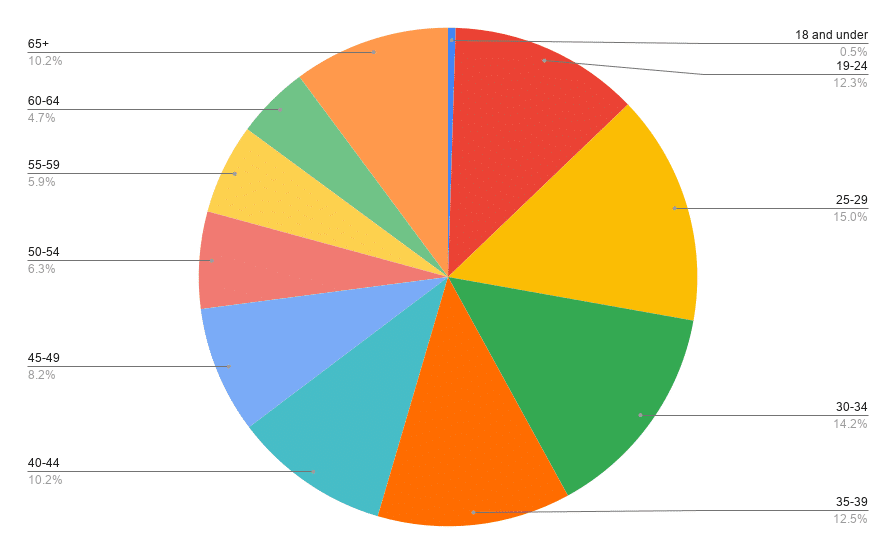
While similar in some ways to the United States data, those 19 to 34 are a far greater percent of the worldwide population.

Worldwide age breakdown for tabletop games in July 2026

Relationship Status

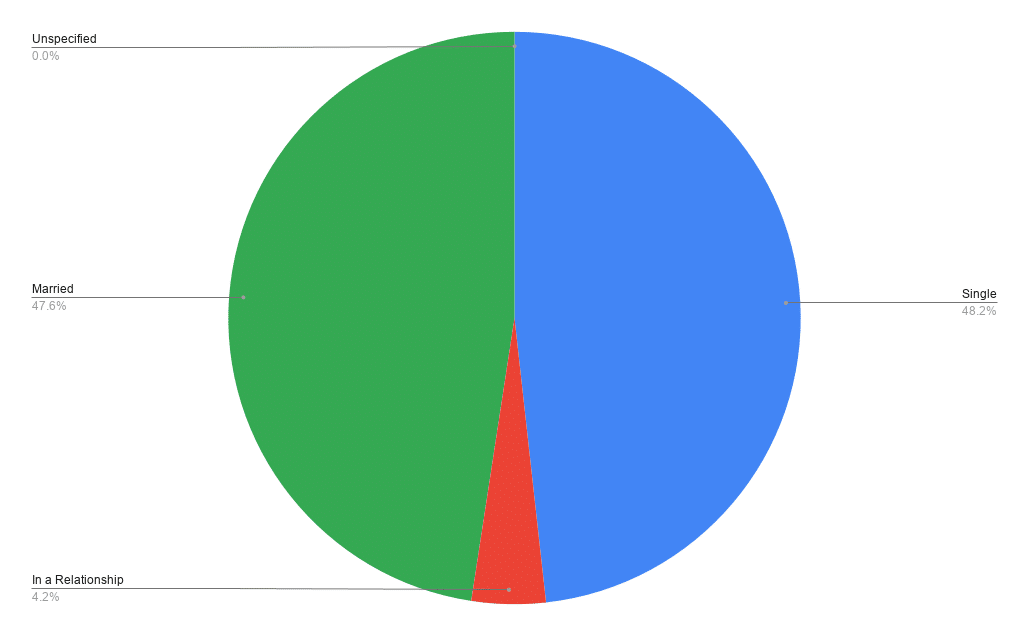
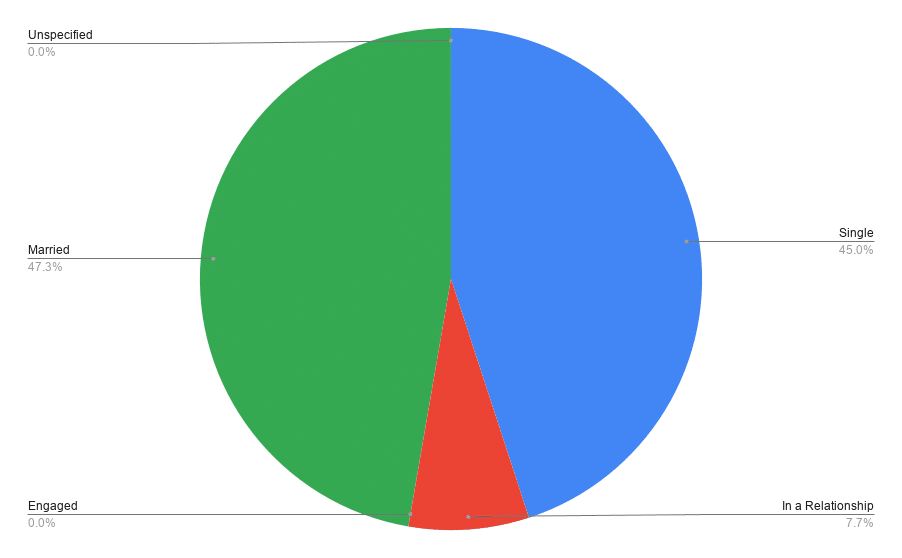
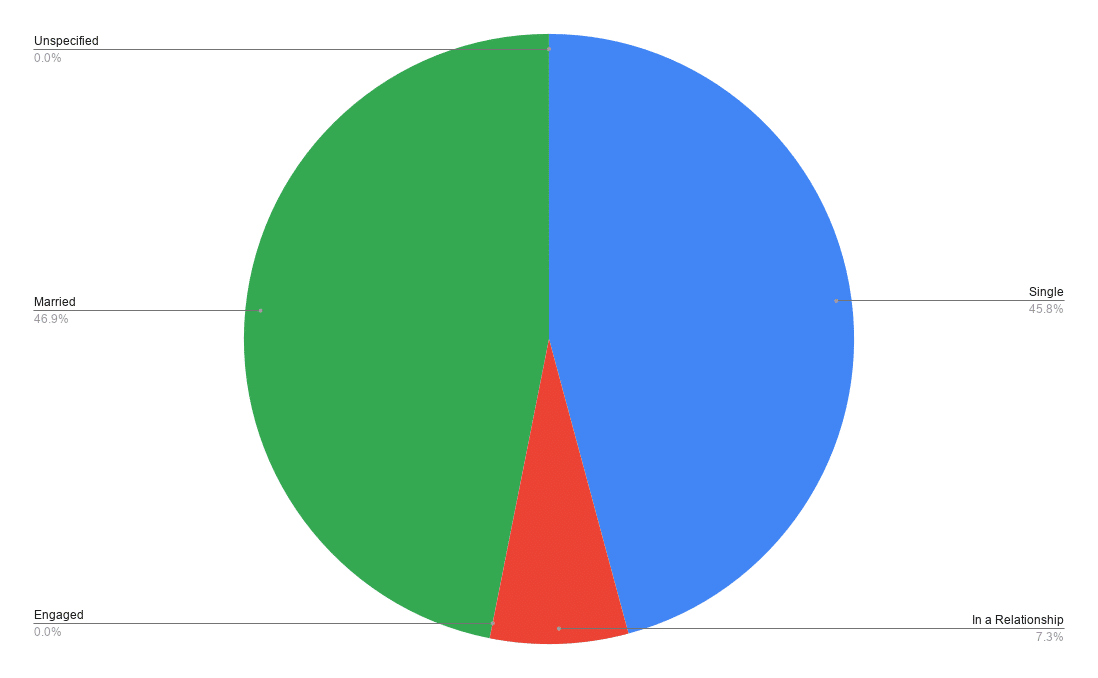
This status saw some bizarre returns, the same thing is happening with our monthly “comic fan” reporting and this is the third month this has happened. Both “engaged” and “unspecified” dropped to less than 1,000.

Facebook Worldwide tabletop relationship status July 2026

More Stats!

Spanish Speakers: 96.3 million individuals are Spanish speakers, 15.9%, which is below the 19.97% in the United States.

Education: 118.15 million have at least a college degree, that’s 19.51%.

Parents: 107.4 million, 17.73%, are parents! That’s a bit higher than the 16.48% in the United States.

And finally, what’s the crossover with fans of board games and video games?

Comic Book fans: 347.45 million (57.37%)
Video Game fans: 352.5 million (58.21%)
Comic Book and Video Game fans: 210.7 million (34.79%)
Comic Book or Video Game fans: 499.15 million (82.42%)

Demo-Graphics: Tabletop Game Edition – July Sees a Jump of Nearly 3 Million Individuals

Demo-Graphics has generally focused on the demographics of comic fans but occasionally we have also reported on other fandoms and communities. In August 2025, we kicked off a new regular look at those interested in tabletop games. That includes board games, roleplaying games, and card games. Why? The question still remains… who are the fans of tabletop games?

What is Demo-Graphics?

Each month I dive into data from Facebook looking at the various demographics it can tell us about comic, and now tabletop game, fans. This isn’t hard numbers, purchasers, or “Wednesday warriors,” but best used to show trends in the industry and the potential of the market out there.

How does it work?

We use key terms, “likes”, that users have indicated and have come up with our own set to measure each month. There’s over 50 terms used (and no I won’t release them). We stick to specific terms for the industry such as “board games” and “collectible card games” as well as publishers and leave out broad terms.

Other things to know…

This data is important in that it shows who the potential audience could be. These are not purchasers, these are people who have shown an affinity for tabletop games, are potential purchasers, and those with a clear interest.

Also, with this being online/technology, due to laws and restrictions, those under the age of 13 are underrepresented.

The data that is presented as a wide range. I’ve taken the average of the range. So, if it’s presented as somewhere between 500 and 1,000 people, the number would be 750.

So, let’s kick off the first entry with the big question…

Facebook “Tabletop Gamer” Population: Around 78.6 million in the United States

The Facebook population increased by about 2.1 million over the month and the tabletop community outpaced that by increasing 2.95 million over the same time frame.

Gender

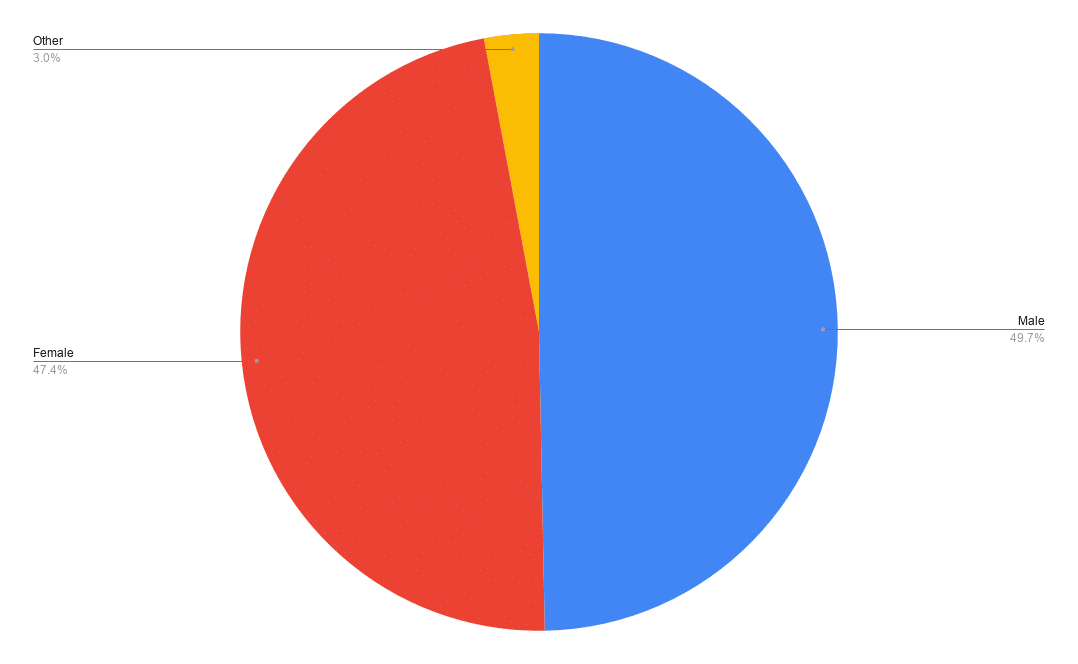
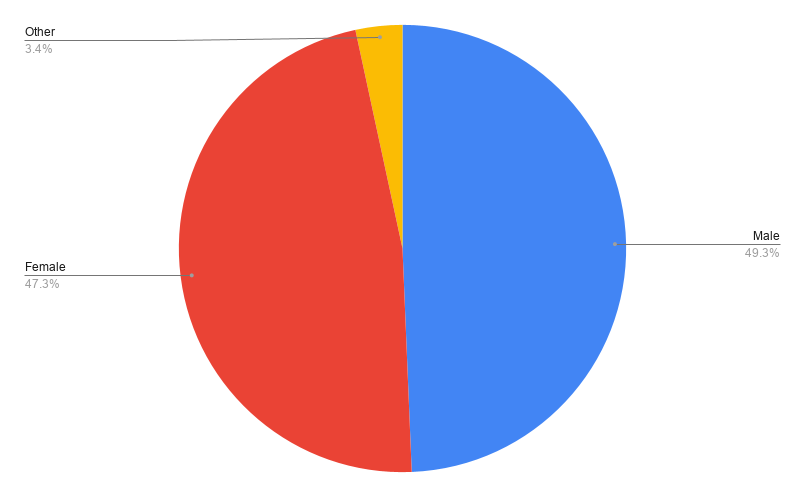
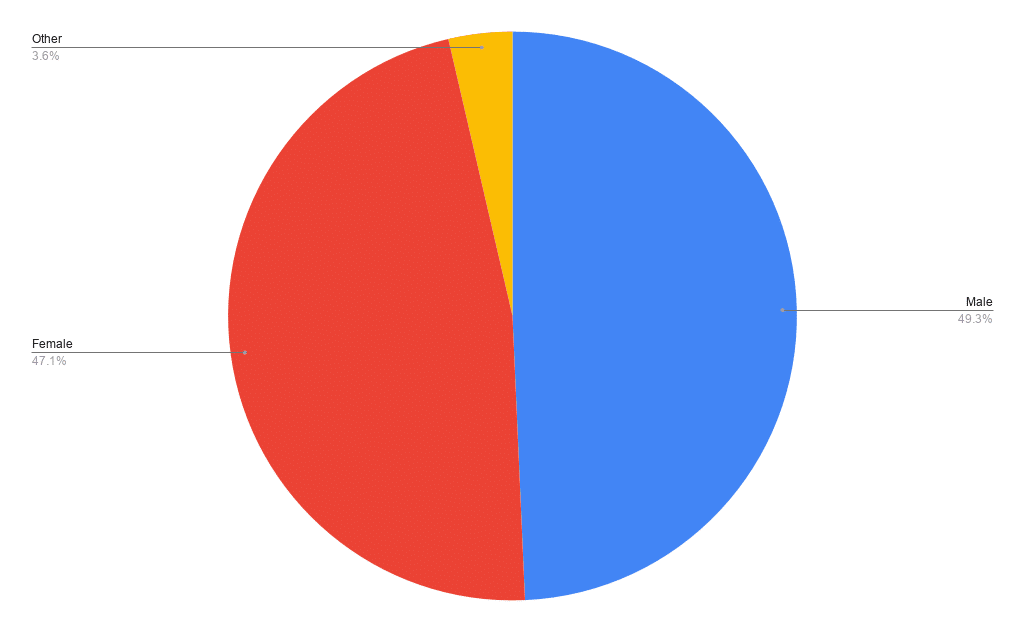
Men remained the majority though lost ground as both women and those not reporting their gender increased. Men increased in population by their percent of the population decreased from 50.36% to 49.30%. Women increased from 46.93% to 47.07% and those who don’t have gender reported increased from 2.71% to 3.63%.

Gender breakdown for tabletop games in July 2026

Age

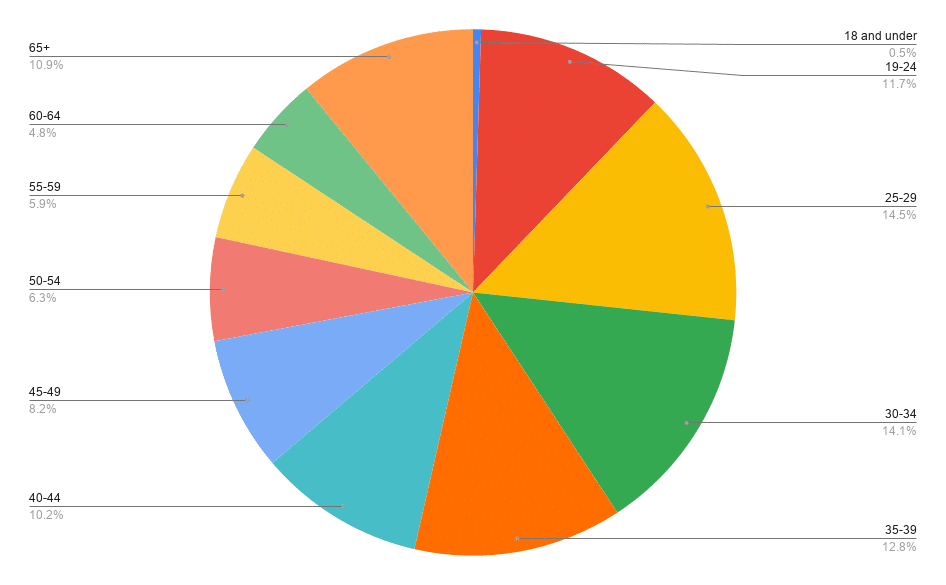
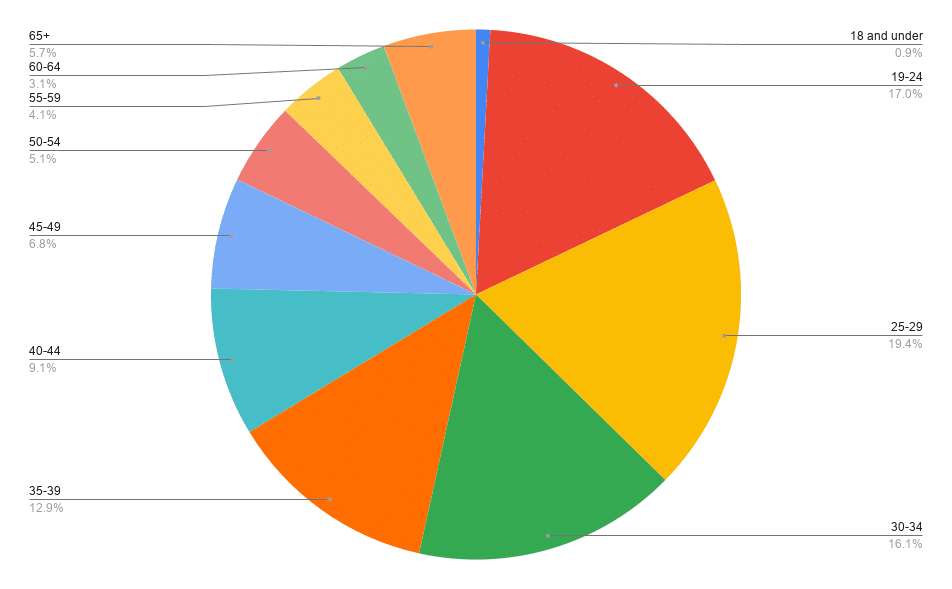
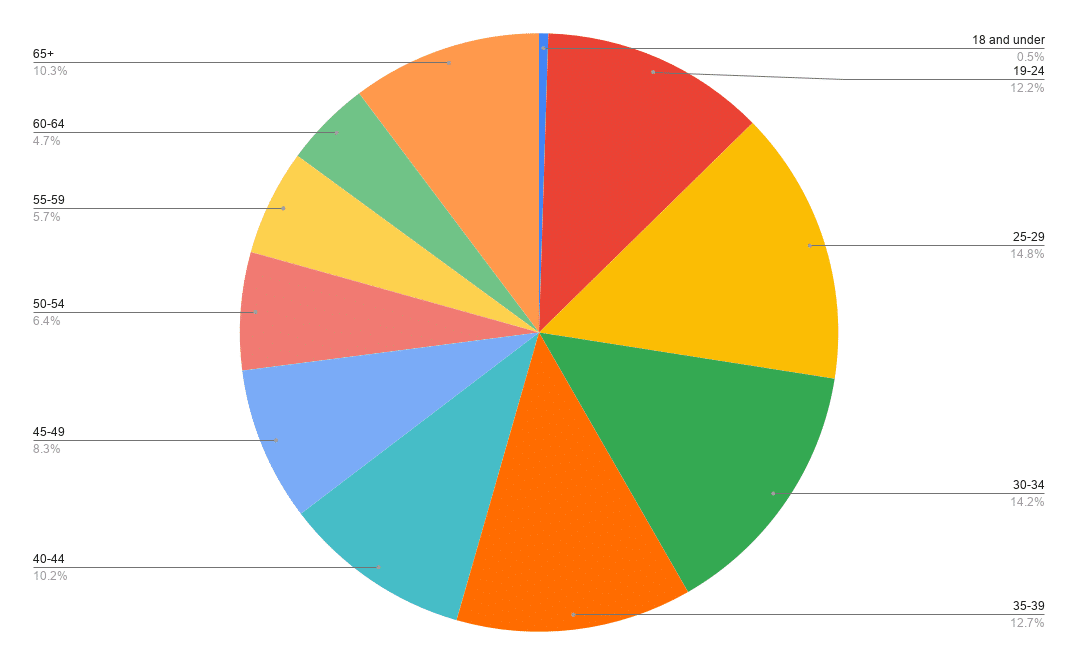
Interestingly, those age 18 and under creased in population size while 19-24 remained the same from the previous month. When it comes to the percentage, 25 to 39 lost ground but 40 and up all gained in their share of the percent.

Age breakdown for tabletop games in July 2026

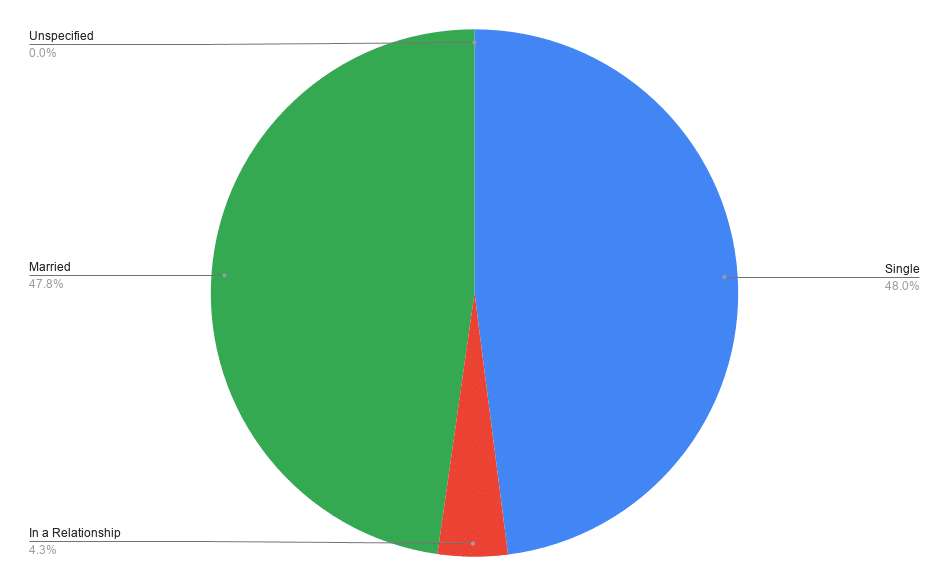
Relationship Status

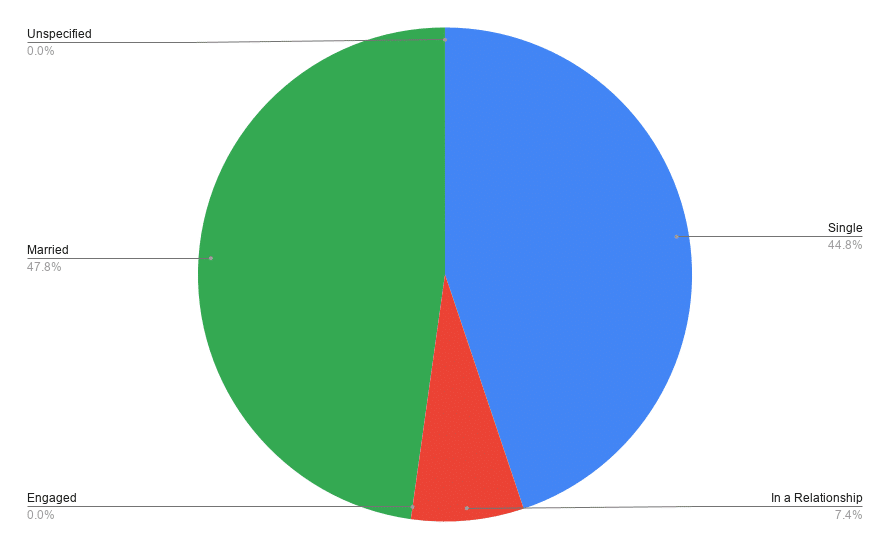
This status saw some bizarre returns, the same thing is happening with our monthly “comic fan” reporting and this is the third month this has happened. Both “engaged” and “unspecified” dropped to less than 1,000.

Facebook tabletop relationship status July 2026

More Stats!

Spanish Speakers: Increased to 15.7 million (19.97%) which is up in count from last month’s 15.45 million but down from its percent of 20.42%.

Education: This month is up from the previous with 12.3 million, an increase of 300,000.

Parents: 12.95 million, 16.48%, are parents! That’s a increase of 1.75 million individuals from the previous month.

And finally, what’s the crossover with fans of board games and video games?

Comic Book fans: 47.35 million (60.24%)
Video Game fans: 42.65 million (54.26%)
Comic Book and Video Game fans: 25.7 million (32.7%)
Comic Book or Video Game fans: 64.95 million (82.63%)

Demo-Graphics: We’re Going Worldwide! Comic Fans Around the World!

Demo-Graphics is back! Demo-Graphics was relaunched in 2025 because the question still remains… who are comic fans?

What is Demo-Graphics?

Each month I dive into data from Facebook looking at the various demographics it can tell us about comic fans. This isn’t hard numbers, purchasers, or “Wednesday warriors,” but best used to show trends in the industry and the potential of the market out there. This has shown the shift towards women being a major force in readers and a shift to the younger demographic.

How does it work?

We use key terms, “likes”, that users have indicated and have come up with our own set to measure each month. There’s over 50 terms used (and no I won’t release them). We stick to specific terms for the industry such as “comics” and “graphic novels” and “one-shots” as well as publishers and leave out broad terms like specific characters or stories. Just because someone likes Batman doesn’t mean they like comics.

Other things to know…

This data is important in that it shows who the potential comic audience could be. These are not purchasers, these are people who have shown an affinity for comics, are potential purchasers, and those with a clear interest.

Also, with this being online/technology, due to laws and restrictions, those under the age of 13 are underrepresented.

Since the last time this feature was run, Facebook has made adjustments as to what it can report so some data is no longer available and we’ve also added in new data that hasn’t been reported before, and it now presents the data as a wide range. I’ve taken the average of the range. So, if it’s presented as somewhere between 500 and 1,000 people, the number would be 750.

So, let’s kick off the latest entry with the big question…

Facebook “Comic Fan” Population: Around 597.55 million worldwide

While we’ve usually reported on stats in the United States, we’re going worldwide with our reporting to give an even better idea of what the possible comic market could look like. 597.55 million individuals match our search criteria out of 3.428 billion individuals on Facebook. That means 17.43% of Facebook profiles worldwide show some interest in comic books (which includes manga, graphic novels, webtoons, and comic strips).

Gender

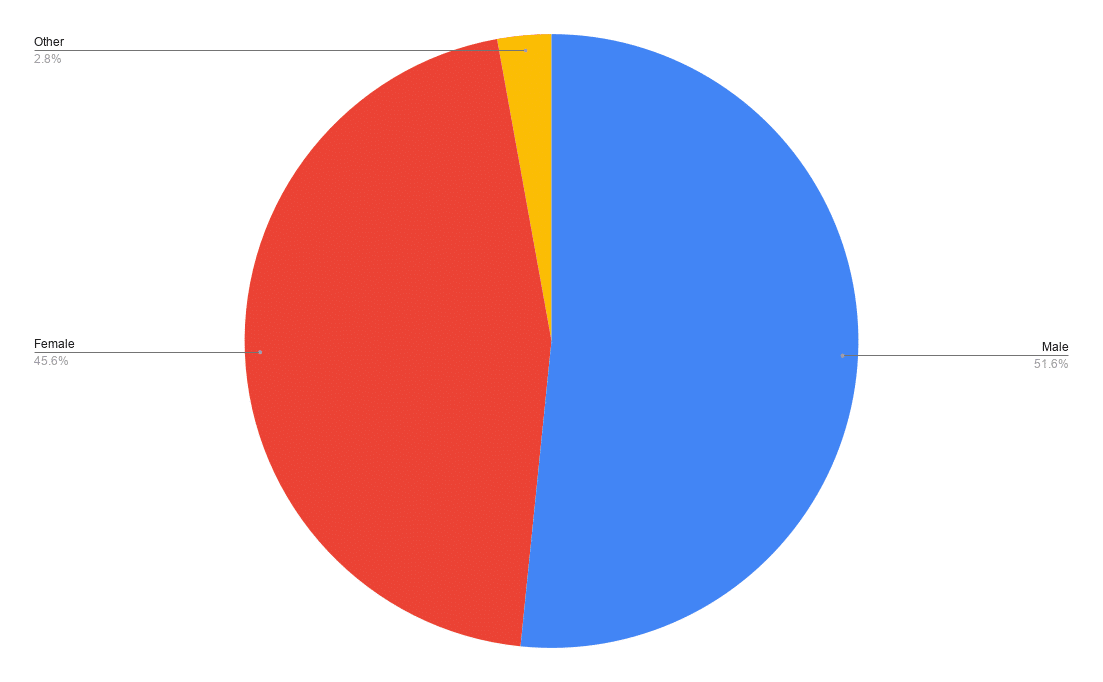
On Facebook, men account for about 54.41% of all users while women account for 43.48%. that’s a 10.93 point gap. When it comes to comic fans, things skewer closer with men account for 51.8% and women are 46.6%, that cuts the gap over in half to just 5.2 points.

Facebook comic fans gender July 2026 worldwide

Age

Compared to the US, those age 50 and above make up a smaller percentage of the overall segment with the other groupings increasing with the exception over “18 and under” which is just a hair smaller as far as percent.

Facebook Comic Age July 2026 worldwide

Relationship Status

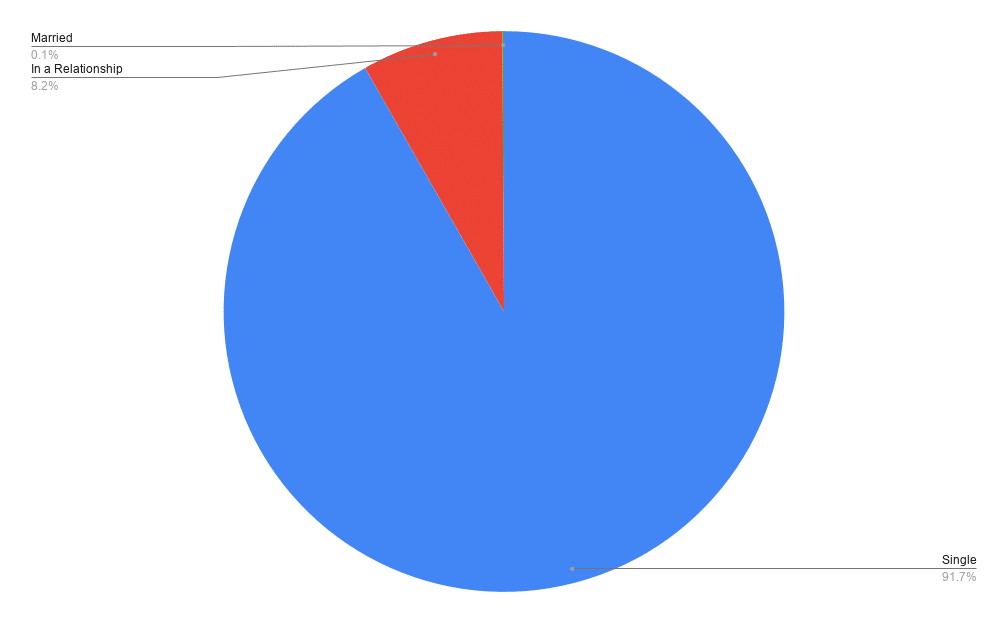
The issue we’ve seen for relationship status persists internationally with some reporting as under 1,000 individuals, which is no way correct. So, take the below with a grain of salt for those at 0%.

Facebook comics relationship status worldwide july 2026

More States

Spanish Speakers: There are 105.55 million Spanish speakers that are also comic fans worldwide. That’s 17.67% of the comic fan population compared to the 20.38% of the fans that are in the United States.

Education: 112.65 million have a college degree or better worldwide.

Parents: 107.3 million individuals are parents.

Board Game and Comic Fans: 353.7 million
Video Game and Comic Fans:
300.25 million
Board Game and Video Game Fans and Comic:
213.4 million
Board Game or Video Game Fans and Comic:
446.05 million

Demo-Graphics: Comic Fans see an Increase after three Months of Decreases

Demo-Graphics is back! Demo-Graphics was relaunched in 2025 because the question still remains… who are comic fans?

What is Demo-Graphics?

Each month I dive into data from Facebook looking at the various demographics it can tell us about comic fans. This isn’t hard numbers, purchasers, or “Wednesday warriors,” but best used to show trends in the industry and the potential of the market out there. This has shown the shift towards women being a major force in readers and a shift to the younger demographic.

How does it work?

We use key terms, “likes”, that users have indicated and have come up with our own set to measure each month. There’s over 50 terms used (and no I won’t release them). We stick to specific terms for the industry such as “comics” and “graphic novels” and “one-shots” as well as publishers and leave out broad terms like specific characters or stories. Just because someone likes Batman doesn’t mean they like comics.

Other things to know…

This data is important in that it shows who the potential comic audience could be. These are not purchasers, these are people who have shown an affinity for comics, are potential purchasers, and those with a clear interest.

Also, with this being online/technology, due to laws and restrictions, those under the age of 13 are underrepresented.

Since the last time this feature was run, Facebook has made adjustments as to what it can report so some data is no longer available and we’ve also added in new data that hasn’t been reported before, and it now presents the data as a wide range. I’ve taken the average of the range. So, if it’s presented as somewhere between 500 and 1,000 people, the number would be 750.

So, let’s kick off the latest entry with the big question…

Facebook “Comic Fan” Population: Around 75.3 million in the United States

After three months of decreases, the “comic fan” population on Facebook increased by about 1 million. Overall, Facebook users in the US increased by 2.1 million, so some of the increase is due to that. While the increase is more than June’s result, it’s still smaller than May’s reporting which was 75.7 million.

As noted below, there’s some oddities for reporting where numbers that made sense normally suddenly decreased and remained low this month.

Gender

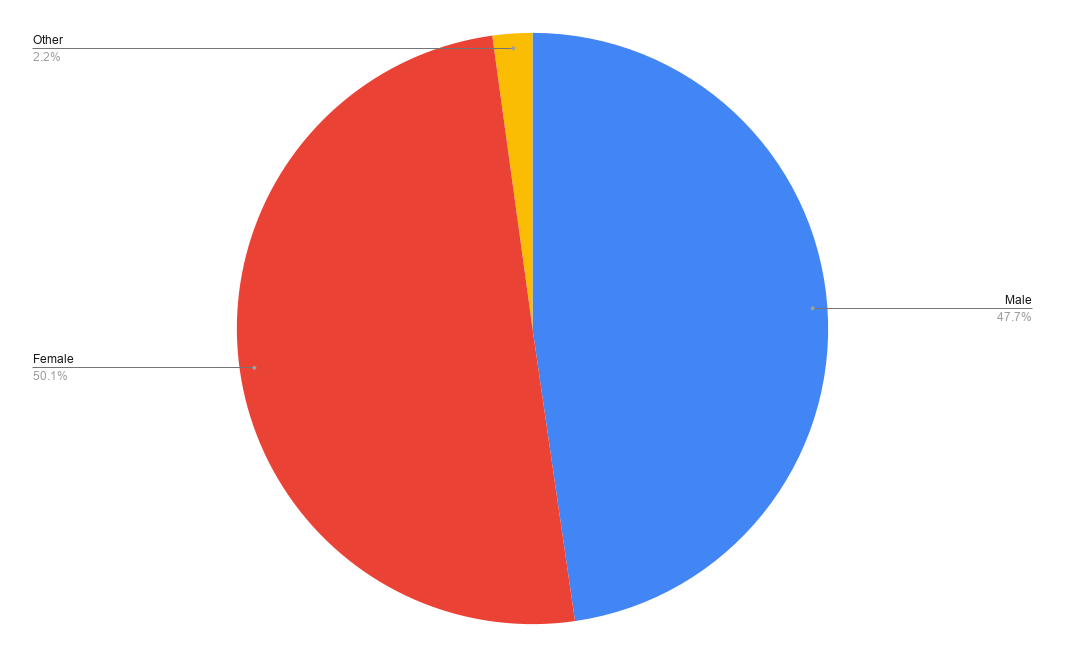
Women increased 450,000 from the previous month while men increased the same amount. Those unknown increased by about 100,000. Women account for 50.3% of the population, a decrease from last month’s 50.9%. Men are 47.7%, the same as last month. Those who don’t report a gender account for 2.0%, an increase from last month’s 1.9%.

Facebook comic fans gender July 2026

Age

While the percentages didn’t shift much, if at all from the previous month, almost every segment increased in population. But, those age “19-24” decreased from the previous month by 200,000 individuals.

Facebook Comic Age July 2026

Relationship Status

This is one of the stats that has been odd. Those marked “engaged” and those as “unspecified” each dropped to less than 1,000 individuals last month and remained there this month We’ll see if things return to more expected numbers next month but it’s an odd result.

Facebook Comic Relationship Status July 2026

New Stats!

Spanish Speakers: Last month there were 14.7 million individuals that were “comic fans” and Spanish speakers but this month sees an increase to 15.35 million, that’s the same amount from May 2026.

Education: This is another stat that’s rather odd. Two months ago, 12 million had at least a college degree, down from the previous month’s 21.8 million. Last month, it increased slightly to 12.1 million. This month remains at 12.1 million, even with the increased overall population.

Parents: After a slide down to 10.65 million in June 2026 from 22.65 million in January, things increased in July to 12.3 million, an increase of 1.65 million.

Board Game and Comic Fans: 48.25 million
Video Game and Comic Fans:
38.2 million
Board Game and Video Game Fans and Comic:
26.25 million
Board Game or Video Game Fans and Comic:
60.15 million

Demo-Graphics: Tabletop Game Edition – June continues the drop as Facebook users dip

Demo-Graphics has generally focused on the demographics of comic fans but occasionally we have also reported on other fandoms and communities. In August 2025, we kicked off a new regular look at those interested in tabletop games. That includes board games, roleplaying games, and card games. Why? The question still remains… who are the fans of tabletop games?

What is Demo-Graphics?

Each month I dive into data from Facebook looking at the various demographics it can tell us about comic, and now tabletop game, fans. This isn’t hard numbers, purchasers, or “Wednesday warriors,” but best used to show trends in the industry and the potential of the market out there.

How does it work?

We use key terms, “likes”, that users have indicated and have come up with our own set to measure each month. There’s over 50 terms used (and no I won’t release them). We stick to specific terms for the industry such as “board games” and “collectible card games” as well as publishers and leave out broad terms.

Other things to know…

This data is important in that it shows who the potential audience could be. These are not purchasers, these are people who have shown an affinity for tabletop games, are potential purchasers, and those with a clear interest.

Also, with this being online/technology, due to laws and restrictions, those under the age of 13 are underrepresented.

The data that is presented as a wide range. I’ve taken the average of the range. So, if it’s presented as somewhere between 500 and 1,000 people, the number would be 750.

So, let’s kick off the first entry with the big question…

Facebook “Tabletop Gamer” Population: Around 75.65 million in the United States

The Facebook population decreased by about 900,000 over the month and the tabletop community dropped by about 1.05 million. This is the fifth month in a row tabletop fans have decreased. The comic fans also saw a drop, this has also been multiple months in a row. It’s possible the “geek” population is leaving Facebook or there’s an overall decrease, likely due to economic reasons. Both reports have been dealing with similar oddities. In the previous month, some reporting came back with results that made little sense, indicating either a glitch in Facebook or something has changed with the data reported. That continued this month.

Gender

Men remained the majority increasing slightly to 50.36%, up from the previous month’s 50.07%. While the percentage increased, the overall population decreased by 300,000. Women saw their percentage decrease slightly to 46.93% from the previous month’s 47.52%. Women decrease by about 950,000. Those who are not reported as either gender increased by 200,000 going from 2.41% to 2.71%.

Gender breakdown for tabletop games in June 2026

Age

The data for “age” is rather interesting with a mix of some groupings increasing and others decreasing while others remained the same. “18 and under” increased again in the population while “19-24” and “40-44” remained the same. The rest all decreased by varying degrees with the drop being anywhere from 50,000 to 550,000.

Age breakdown for tabletop games in June 2026

Relationship Status

This status saw some bizarre returns, the same happened with our monthly “comic fan” reporting and this is the second month this has happened. Both “engaged” and “unspecified” dropped to less than 1,000. “In a relationship” increased by 50,000. We’ll see if these numbers return to much more expected results next month.

Facebook tabletop relationship status June 2026

More Stats!

Spanish Speakers: NEW STAT! – 15.45 million (20.42%). That’s the same amount of individuals as the previous month.

Education: This is another state with a very weird result. 12 million, 15.86% have a college degree or higher, a drop of 350,000 from the previous month. In 2022, 37.7% of the American population had at least a college degree.

Parents: 11.2 million, 14.81%, are parents! That’s a decrease of 450,000 individuals from the previous month.

And finally, what’s the crossover with fans of board games and video games? 44.05 million, 58.23% of board game fans also enjoy comics. 41.2 million, 54.46% also enjoy video games. Combined, 62.15 million like board games or video games and 23 million enjoy board games and video games. Get your licensing engines revving!

Demo-Graphics: Comic Fans Dip Again while Facebook Also Decreases

Demo-Graphics is back! Demo-Graphics was relaunched in 2025 because the question still remains… who are comic fans?

What is Demo-Graphics?

Each month I dive into data from Facebook looking at the various demographics it can tell us about comic fans. This isn’t hard numbers, purchasers, or “Wednesday warriors,” but best used to show trends in the industry and the potential of the market out there. This has shown the shift towards women being a major force in readers and a shift to the younger demographic.

How does it work?

We use key terms, “likes”, that users have indicated and have come up with our own set to measure each month. There’s over 50 terms used (and no I won’t release them). We stick to specific terms for the industry such as “comics” and “graphic novels” and “one-shots” as well as publishers and leave out broad terms like specific characters or stories. Just because someone likes Batman doesn’t mean they like comics.

Other things to know…

This data is important in that it shows who the potential comic audience could be. These are not purchasers, these are people who have shown an affinity for comics, are potential purchasers, and those with a clear interest.

Also, with this being online/technology, due to laws and restrictions, those under the age of 13 are underrepresented.

Since the last time this feature was run, Facebook has made adjustments as to what it can report so some data is no longer available and we’ve also added in new data that hasn’t been reported before, and it now presents the data as a wide range. I’ve taken the average of the range. So, if it’s presented as somewhere between 500 and 1,000 people, the number would be 750.

So, let’s kick off the latest entry with the big question…

Facebook “Comic Fan” Population: Around 74.3 million in the United States

We’re now three months in a row that the overall “comic fan” population has dropped. It’s down about 1.4 million from the previous month, more than the 900,000 decrease for Facebook’s overall users in the United States. Men decreased by 1 million while women decreased by 400,000. The population that doesn’t list either gender remained steady at 1.4 million.

As noted below, there’s some oddities for reporting where numbers that made sense normally suddenly decreased and remained low this month.

Gender

Women remained a majority of the population with 50.9% of the population. Last month they accounted for 50%. Men decreased as a percentage from last month’s 48.2% to 47.7%. Those who don’t report themselves as “male” or “female” account for 1.9%, up from 1.8%.

Facebook comic fans gender June 2026

Age

The biggest issue with all of this reporting is the limitation of those under the age of 13 using the system. With new laws limiting the use of social media by children, it’ll be interesting to see if this shifts at all. Compared to the previous month most every grouping decreased except those “50-54,” “55-59,” and “60-64.”

Facebook Comic Age June 2026

Relationship Status

This is one of the stats that has been odd. Those marked “engaged” and those as “unspecified” each dropped to less than 1,000 individuals last month and remained there this month We’ll see if things return to more expected numbers next month but it’s one of the odd results.

Facebook Comic Relationship Status June 2026

New Stats!

Spanish Speakers: Last month we first reported there were 15.35 million Spanish speakers who are comic fans in the US. In June 2026, that number was dipped to 14.7 million.

Education: This is another stat that’s rather odd. Last month 12 million had at least a college degree, down from the previous month’s 21.8 million. This month things increased slightly to 12.1 million but it’s still very odd to see such a dramatic drop.

Parents: This continues to slide down to 10.65 million from 22.65 million in January and 10.9 million the previous month.

Board Game Fans: 47.5 million
Video Game Fans:
37.1 million
Board Game and Video Game Fans:
25.45 million
Board Game or Video Game Fans:
58.85 million

Demo-Graphics: Tabletop Game Edition – May continues the drop as Facebook users gain

Demo-Graphics has generally focused on the demographics of comic fans but occasionally we have also reported on other fandoms and communities. In August 2025, we kicked off a new regular look at those interested in tabletop games. That includes board games, roleplaying games, and card games. Why? The question still remains… who are the fans of tabletop games?

What is Demo-Graphics?

Each month I dive into data from Facebook looking at the various demographics it can tell us about comic, and now tabletop game, fans. This isn’t hard numbers, purchasers, or “Wednesday warriors,” but best used to show trends in the industry and the potential of the market out there.

How does it work?

We use key terms, “likes”, that users have indicated and have come up with our own set to measure each month. There’s over 50 terms used (and no I won’t release them). We stick to specific terms for the industry such as “board games” and “collectible card games” as well as publishers and leave out broad terms.

Other things to know…

This data is important in that it shows who the potential audience could be. These are not purchasers, these are people who have shown an affinity for tabletop games, are potential purchasers, and those with a clear interest.

Also, with this being online/technology, due to laws and restrictions, those under the age of 13 are underrepresented.

The data that is presented as a wide range. I’ve taken the average of the range. So, if it’s presented as somewhere between 500 and 1,000 people, the number would be 750.

So, let’s kick off the first entry with the big question…

Facebook “Tabletop Gamer” Population: Around 76.7 million in the United States

The Facebook population increased by about 3.85 million over the month but the tabletop community dropped by about 1.75 million. This is the fourth month in a row tabletop fans has decreased and second where Facebook saw a user increase but tabletop fans dropped. The comic fans also saw a drop, with similar oddities in the report. Some reporting came back with results that made little sense, indicating either a glitch in Facebook or something has changed with the data reported.

Gender

Men remained the majority increasing slightly to 50.7%, up from the previous month’s 50.16%. While the percentage increased, the overall population decreased by 950,000. The previous month saw the population remain the same but percentage increase because the overall population decreased. Women saw their percentage decrease slightly to 47.52%, up from the previous month’s 47.99%. Women decrease by about 1.2 million. Those who are not reported as either gender increased by 400,000 going from 1.85% to 2.41%.

Gender breakdown for tabletop games in May 2026

Age

The data for “age” is rather interesting with a mix of some groupings increasing and others decreasing while others remained the same. “18 and under” increased in the population while “19-24” and “25-29” remained the same. The rest all decreased by varying degrees with the drop being anywhere from 50,000 to 450,000.

Age breakdown for tabletop games in May 2026

Relationship Status

This status saw some bizarre returns, the same happened with our monthly “comic fan” reporting. Both “engaged” and “unspecified” dropped to less than 1,000. “In a relationship” saw a steep drop of 4.05 million and “married” decreased by 8.8 million. We’ll see if these numbers return to much more expected results next month.

Facebook tabletop relationship status May 2026

More Stats!

Spanish Speakers: NEW STAT! – 15.45 million (20.14%)

Education: This is another state with a very weird result. 12.35 million, 16.10% have a college degree or higher, a drop of 8.45 million from the previous month. In 2022, 37.7% of the American population had at least a college degree.

Parents: 11.65 million, 15.19%, are parents! That’s a decrease of 2.05 million individuals from the previous month.

And finally, what’s the crossover with fans of board games and video games? 44.8 million, 58.41% of board game fans also enjoy comics. 42.55 million, 55.48% also enjoy video games. Combined, 63.1 million like board games or video games and 24.3 million enjoy board games and video games. Get your licensing engines revving!

Demo-Graphics: Comic Fans Continue to Tumble While Facebook Continues to Grow

Demo-Graphics is back! Demo-Graphics was relaunched in 2025 because the question still remains… who are comic fans?

What is Demo-Graphics?

Each month I dive into data from Facebook looking at the various demographics it can tell us about comic fans. This isn’t hard numbers, purchasers, or “Wednesday warriors,” but best used to show trends in the industry and the potential of the market out there. This has shown the shift towards women being a major force in readers and a shift to the younger demographic.

How does it work?

We use key terms, “likes”, that users have indicated and have come up with our own set to measure each month. There’s over 50 terms used (and no I won’t release them). We stick to specific terms for the industry such as “comics” and “graphic novels” and “one-shots” as well as publishers and leave out broad terms like specific characters or stories. Just because someone likes Batman doesn’t mean they like comics.

Other things to know…

This data is important in that it shows who the potential comic audience could be. These are not purchasers, these are people who have shown an affinity for comics, are potential purchasers, and those with a clear interest.

Also, with this being online/technology, due to laws and restrictions, those under the age of 13 are underrepresented.

Since the last time this feature was run, Facebook has made adjustments as to what it can report so some data is no longer available and we’ve also added in new data that hasn’t been reported before, and it now presents the data as a wide range. I’ve taken the average of the range. So, if it’s presented as somewhere between 500 and 1,000 people, the number would be 750.

So, let’s kick off the latest entry with the big question…

Facebook “Comic Fan” Population: Around 75.7 million in the United States

After last month’s adjustment, comic fans decreased this month by about 5.9 million individuals. That’s on top of the 2 million individuals from the previous month. But, overall, Facebook gained around 3.85 million individuals on top of last month’s 2.15 million individuals. Men decreased by 2.8 million while women decreased by 3.05 million. The population that doesn’t list either gender decreased by about 50,000.

It’s possible there’s an issue with Facebook itself, as there’s some strange changes that will be discussed below but this could be a sign of rockier times for the industry to come.

Gender

Women remained a majority of the population with 50% of the population. Last month they accounted for 50.1%. Men increased as a percentage from last month’s 48.1% to 48.2%. Those who don’t report themselves as “male” or “female” account for 1.8%, up from 1.78%.

Age

The biggest issue with all of this reporting is the limitation of those under the age of 13 using the system. With new laws limiting the use of social media by children, it’ll be interesting to see if this shifts at all. But, compared to the previous month, the percentages have changed very little with a few going up or down a tenth of a percent.

Facebook Comic Age May 2026

Relationship Status

This is one of the stats that has been odd. Those marked “engaged” and those as “unspecified” each dropped to less than 1,000 individuals from the previous month’s 1.5 million and 21.3 million. We’ll see if things return to more expected numbers next month but it’s one of the odd results.

Facebook Comic Relationship Status April 2026

New Stats!

Spanish Speakers: New for the month, there’s 15.35 million Spanish speakers who are comic fans in the US.

Education: This is another stat that’s rather odd. This month 12 million have at least a college degree, down from the previous month’s 21.8 million. About 36.4% of Americans have a bachelor degree or better while about 26.72% of comic fans do.

Parents: This continues to slide down to 10.9 million from a 22.65 million in January and 3 million from April 2026.

Board Game Fans: 48.3 million (63.8%)
Video Game Fans:
38.3 million (50.59%)
Board Game and Video Game Fans:
26.6 million (35.14%)
Board Game or Video Game Fans:
59.95 million (79.19%)

Demo-Graphics: Tabletop Game Edition – April sees a bit of a decrease as Facebook users gain

Demo-Graphics has generally focused on the demographics of comic fans but occasionally we have also reported on other fandoms and communities. In August 2025, we kicked off a new regular look at those interested in tabletop games. That includes board games, roleplaying games, and card games. Why? The question still remains… who are the fans of tabletop games?

What is Demo-Graphics?

Each month I dive into data from Facebook looking at the various demographics it can tell us about comic, and now tabletop game, fans. This isn’t hard numbers, purchasers, or “Wednesday warriors,” but best used to show trends in the industry and the potential of the market out there.

How does it work?

We use key terms, “likes”, that users have indicated and have come up with our own set to measure each month. There’s over 50 terms used (and no I won’t release them). We stick to specific terms for the industry such as “board games” and “collectible card games” as well as publishers and leave out broad terms.

Other things to know…

This data is important in that it shows who the potential audience could be. These are not purchasers, these are people who have shown an affinity for tabletop games, are potential purchasers, and those with a clear interest.

Also, with this being online/technology, due to laws and restrictions, those under the age of 13 are underrepresented.

The data that is presented as a wide range. I’ve taken the average of the range. So, if it’s presented as somewhere between 500 and 1,000 people, the number would be 750.

So, let’s kick off the first entry with the big question…

Facebook “Tabletop Gamer” Population: Around 78.45 million in the United States

The Facebook population increased by about 2.15 million over the month but the tabletop community dropped by about 550,000. The comic fans also saw a drop, though one that was far more dramatic.

Gender

Men remained the majority increasing slightly to 50.16%, up from the previous month’s 50%. Women saw their percentage increase slightly o 47.99%, up from the previous month’s 47.78%. Both of those gains come from “other,” those whose gender are unknown and not reported, which dipped to 1.85% from 2.22% in March. There were drops in the population across the board with men down 150,000, women down 100,000, and “other” down 300,000.

Gender breakdown for tabletop games in April 2026

Age

When it comes to percentages, the age groupings shifted very little. There’s some slight changes in tenths of a percent but no wild swings. All of the groupings either remained the same or dropped from the previous month.

Age breakdown for tabletop games in April 2026

Relationship Status

All relationship statuses either remained the same or dropped a bit from the previous month. Both “in a relationship” and “unspecified” decreased by 100,000 each.

Facebook tabletop relationship status April 2026

More Stats!

For Education we’re tracking individuals who have at least a college degree. 20.8 million individuals, 26.51% of the population have at least a college degree. That’s a decrease in the number of individuals and percentage from the previous month which was 21 million and 26.58%. In 2022, 37.7% of the American population had at least a college degree.

13.7 million fans, 17.46%, are parents! That’s an decrease of 100,000 individuals and 0.01 percentage points.

And finally, what’s the crossover with fans of board games and video games? 48.1 million, 61.31% of board game fans also enjoy comics. 47.8 million, 60.93% also enjoy video games. Combined, 66.6 million like board games or video games and 28.55 million enjoy board games and video games. Get your licensing engines revving!

Demo-Graphics: Comic Fans Dip While Facebook Overall Grows

Demo-Graphics is back! Demo-Graphics was relaunched in 2025 because the question still remains… who are comic fans?

What is Demo-Graphics?

Each month I dive into data from Facebook looking at the various demographics it can tell us about comic fans. This isn’t hard numbers, purchasers, or “Wednesday warriors,” but best used to show trends in the industry and the potential of the market out there. This has shown the shift towards women being a major force in readers and a shift to the younger demographic.

How does it work?

We use key terms, “likes”, that users have indicated and have come up with our own set to measure each month. There’s over 50 terms used (and no I won’t release them). We stick to specific terms for the industry such as “comics” and “graphic novels” and “one-shots” as well as publishers and leave out broad terms like specific characters or stories. Just because someone likes Batman doesn’t mean they like comics.

Other things to know…

This data is important in that it shows who the potential comic audience could be. These are not purchasers, these are people who have shown an affinity for comics, are potential purchasers, and those with a clear interest.

Also, with this being online/technology, due to laws and restrictions, those under the age of 13 are underrepresented.

Since the last time this feature was run, Facebook has made adjustments as to what it can report so some data is no longer available and we’ve also added in new data that hasn’t been reported before, and it now presents the data as a wide range. I’ve taken the average of the range. So, if it’s presented as somewhere between 500 and 1,000 people, the number would be 750.

So, let’s kick off the latest entry with the big question…

Facebook “Comic Fan” Population: Around 81.6 million in the United States

After last month’s adjustment, comic fans decreased this month by about 2 million individuals. But, overall, Facebook gained around 2.15 million individuals. Men decreased by 1.35 million while women decreased by 800,000. The population that doesn’t list either gender increased by about 150,000.

Gender

Women remained a majority of the population but now over half of fans. Last month they accounted for 49.9% of the population but now are 50.12%. Men decreased as a percentage from last month’s 48.6% to 48.1%. Those who don’t report themselves as “male” or “female” account for 1.78, up from 1.6%.

Facebook Comic Gender April 2026

Age

The biggest issue with all of this reporting is the limitation of those under the age of 13 using the system. With new laws limiting the use of social media by children, it’ll be interesting to see if this shifts at all. But, compared to the previous month, the percentages have changed very little with a few going up or down a tenth of a percent.

Facebook Comic Age April 2026

Relationship Status

Compared to the previous goofed stats, the percentages for this month remains pretty steady interestingly. Like “ages” above, they have all shifted up or down a tenth of a percent with no major swings.

Facebook Comic Relationship Status April 2026

New Stats!

Education: 21.8 million have a college degree or higher. About 36.4% of Americans have a bachelor degree or better while about 26.72% of comic fans do.

Parents: 13.9 million (17.03%)

Board Game Fans: 51.5 million (63.11%)
Video Game Fans:
47.1 million (57.72%)
Board Game and Video Game Fans:
31.15 million (38.17%)
Board Game or Video Game Fans:
67.05 million (82.17%)

« Older Entries