
Tag Archives: data

Demo-Graphics: Comic Fandom continues a dip for the year

Demo-Graphics is back with its second entry for 2025! Demo-Graphics was relaunched because the question still remains… who are comic fans? While I got the information for February, I wanted to wait a month to start showing off more trends than a one month change.

What is Demo-Graphics?

Each month I dive into data from Facebook looking at the various demographics it can tell us about comic fans. This isn’t hard numbers, purchasers, or “Wednesday warriors,” but best used to show trends in the industry and the potential of the market out there. This has shown the shift towards women being a major force in readers and a shift to the younger demographic.

How does it work?

We use key terms, “likes”, that users have indicated and have come up with our own set to measure each month. There’s over 50 terms used (and no I won’t release them). We stick to specific terms for the industry such as “comics” and “graphic novels” and “one-shots” as well as publishers and leave out broad terms like specific characters or stories. Just because someone likes Batman doesn’t mean they like comics.

Other things to know…

This data is important in that it shows who the potential comic audience could be. These are not purchasers, these are people who have shown an affinity for comics, are potential purchasers, and those with a clear interest.

Also, with this being online/technology, due to laws and restrictions, those under the age of 13 are underrepresented.

Since the last time this feature was run, Facebook has made adjustments as to what it can report so some data is no longer available and we’ve also added in new data that hasn’t been reported before, and it now presents the data as a wide range. I’ve taken the average of the range. So, if it’s presented as somewhere between 500 and 1,000 people, the number would be 750.

So, let’s kick off the latest entry with the big question…

Facebook “Comic Fan” Population: Around 92.8 million in the United States

2025 is off to an interesting start as we’ve now seen two months in a row in a decrease in the overall population. The loss is nearly across the board as far as age group though 30-34 remained the same and 35-39 increased slightly. These numbers often are ahead of sales trends and we might be seeing unease in the economy playing out in some way. If there’s a continue dip, we mighty see sales issues within a few months.
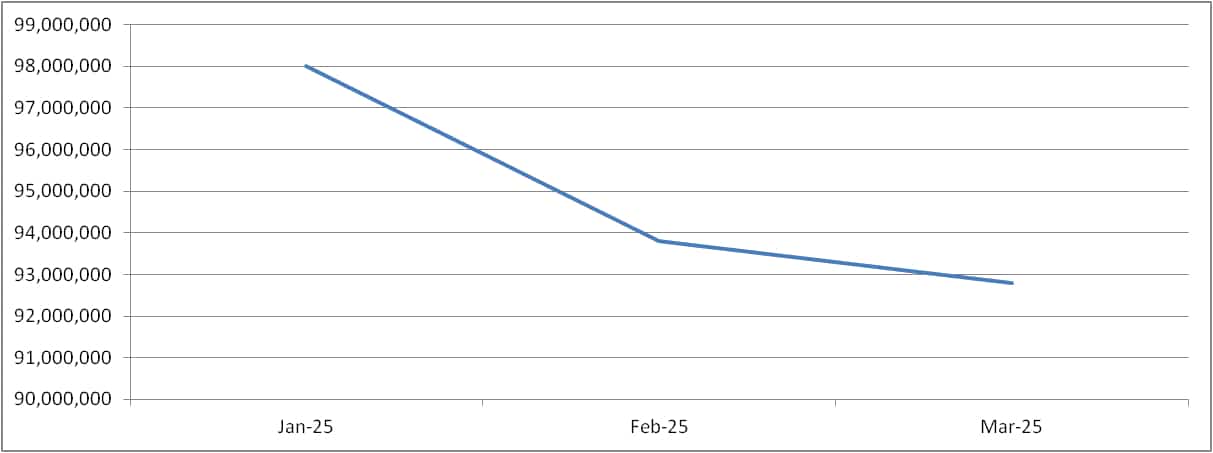
Facebook comic fan population over time

Gender

Women still make up the majority of comic fans but men have made some gains over the months. Women account for 49.95% of the population while men are 48.92%, and other is 1.13%. The gains in those reported as men as seen gains over the months as “other” has decreased. This could be more due to the current negative climate for those not conforming to a binary choice.
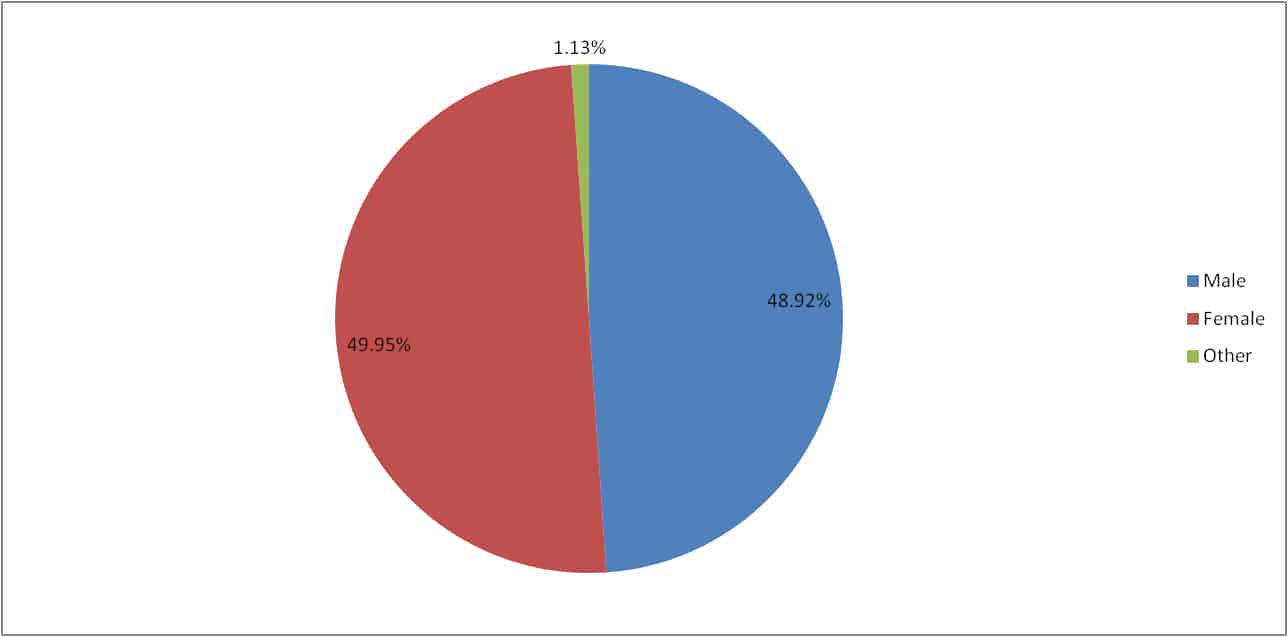
Gender breakdown comic fans Facebook March 2025

Age

I’ve shifted how I’ve grouped ages so the data is a little different than before this year’s relaunch. While before “under 18” was one, it’s now “18 and under” with each subsequent grouping being 5 year blocks. This data is absolutely skewed as 1) It is believed younger individuals don’t use Facebook as much in the past and have migrated to other platforms; and 2) Laws restrict what can be collected based on age, ie those under the age of 13 shouldn’t even have accounts. So, younger readers are absolutely under-counted.
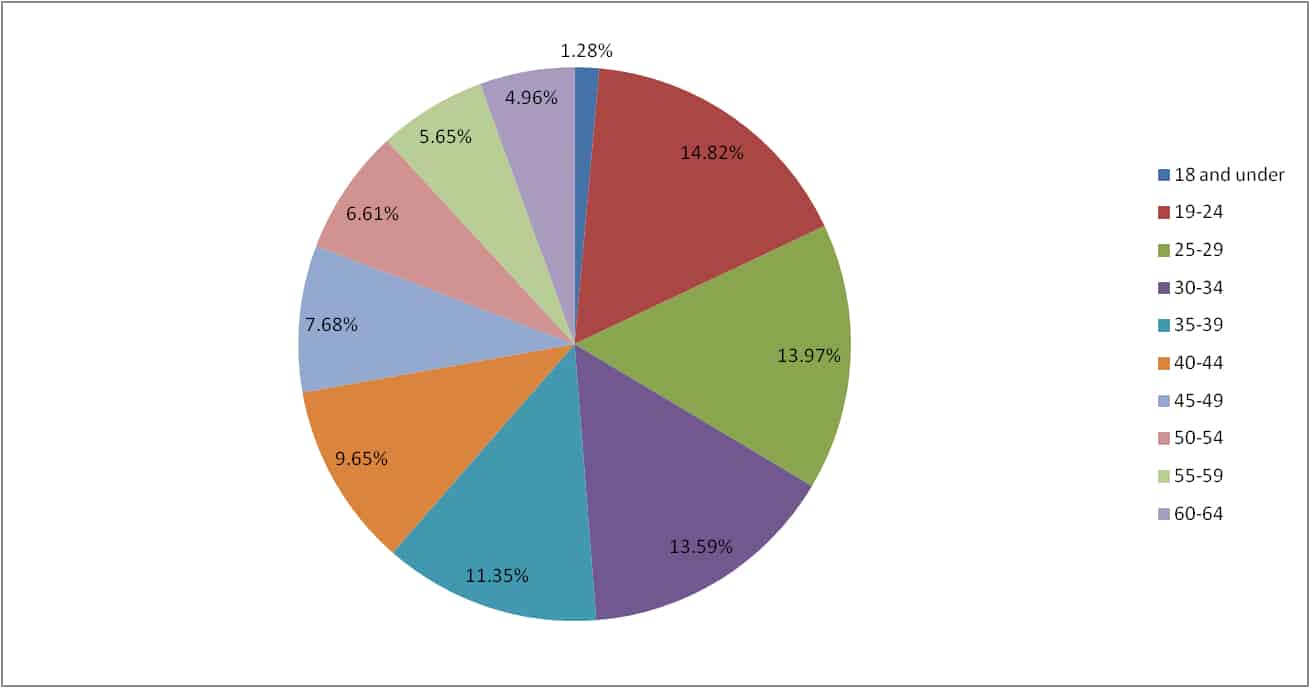
Age breakdown comic fans Facebook March 2025

Relationship Status

Those “married” has decrease over the past few months. It’s possible this is the population that is part of the decrease of the population.
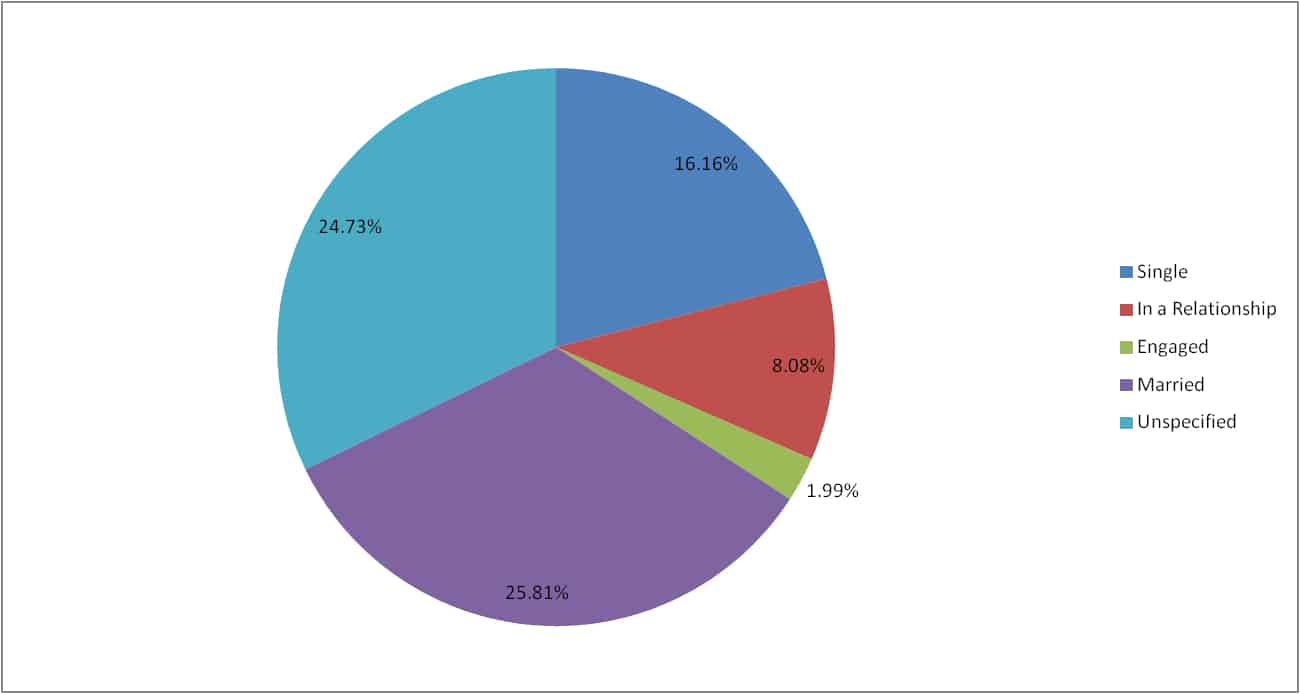
Relationship status breakdown comic fans Facebook March 2025

New Stats!

Education has been combined to see how many individuals have at least a college degree. About 26 million fit that which means 28.02%. In 2022, 37.7% of the American population had at least a college degree.

19.15 million fans, 20.64%, are parents!

And finally, what’s the crossover with fans of board games and video games? 33.5 million, 36.10% of comic fans also enjoy board games. 54.55 million, 58.78% also enjoy video games. Get your licensing engines revving!

What’s Next?

All of this is a re-starting point. Things have shifted in how I’m collecting the data, like age, but it’s been quite a while since I’ve regularly done this. As we move along, we’ll continue to look at trends over time.

There’s some legacy data I’m going to try and fill in so we can get a better sense of how things have shifted over time that will hopefully be available next month. And, part of that will be me trying to find the original data files from many computers ago. Lots of work so we can all have a better sense of where things stand! Until next time… what gets measured, gets done!
Demo-Graphics: Comic Fandom on Facebook is Back!

Demo-Graphics is back! After an almost 4 year break since the last report, I’m relaunching Demo-Graphics because the question still remains… who are comic fans? With a new year, it felt like the right time to bring back the feature monthly and see how trends shift over time.

What is Demo-Graphics?

Each month I dive into data from Facebook looking at the various demographics it can tell us about comic fans. This isn’t hard numbers, purchasers, or “Wednesday warriors,” but best used to show trends in the industry and the potential of the market out there. This has shown the shift towards women being a major force in readers and a shift to the younger demographic.

How does it work?

We use key terms, “likes”, that users have indicated and have come up with our own set to measure each month. There’s over 50 terms used (and no I won’t release them). We stick to specific terms for the industry such as “comics” and “graphic novels” and “one-shots” as well as publishers and leave out broad terms like specific characters or stories. Just because someone likes Batman doesn’t mean they like comics.

Other things to know…

This data is important in that it shows who the potential comic audience could be. These are not purchasers, these are people who have shown an affinity for comics, are potential purchasers, and those with an interest.

Also, with this being online/technology, due to laws and restrictions, those under the age of 13 are underrepresented.

Since the last time this feature was run, Facebook has made adjustments as to what it can report so some data is no longer available and we’ve also added in new data that hasn’t been reported before, and it now presents the data as a wide range. I’ve taken the average of the range. So, if it’s presented as somewhere between 500 and 1,000 people, the number would be 750.

So, let’s kick things off with the big number…

Facebook “Comic Fan” Population: Around 98 million in the United States

I’m honestly kicking myself that I wasn’t tracking this during the pandemic. Interest in collectibles blew up during that time and it’d have been interesting to track how things have shifted. Never before revealed, in January 2023 data was pulled and it revealed a population of 118.3 million. We’ve seen a 17.16% decrease in that two year period and that could match the reported cooling in sales and/or it could also be a decrease in the overall number of individuals on Facebook which was not recorded at the time. In January 2021 the same population was 73 million and in January 2018 it was 57 million.

Gender

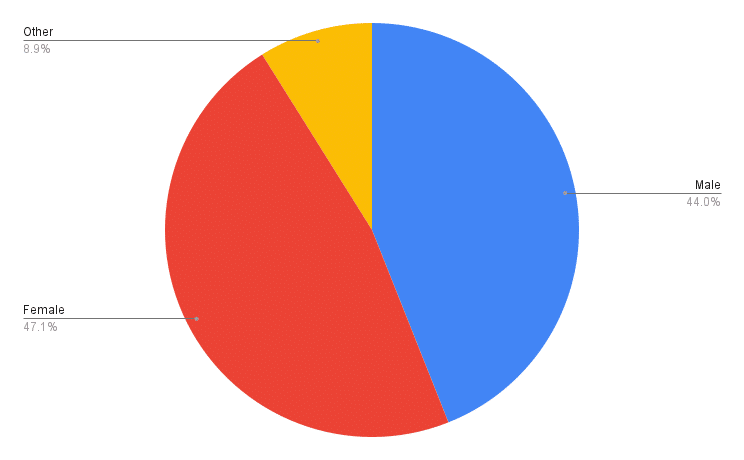
Women still make up the majority of comic fans but those listed as “other” (Facebook is not good on this data) has increased a lot over the years. Women account for 47.12% of the population while men are 43.98%, and other is 8.90%.

Gender breakdown of comic fans on Facebook January 2025

Age

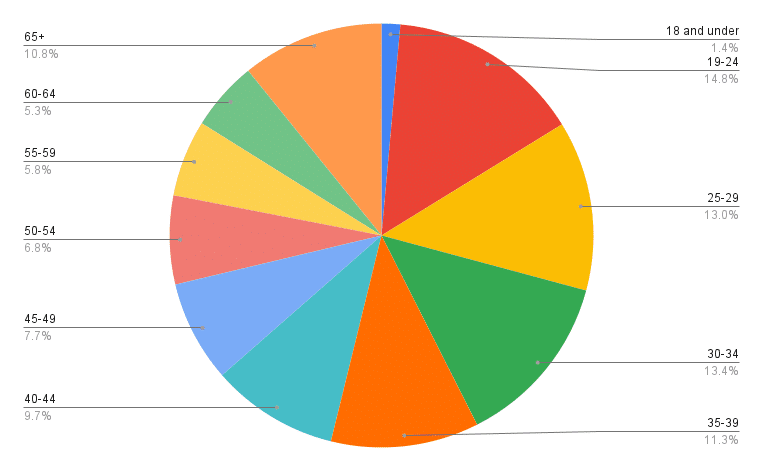
I’ve shifted how I’ve grouped ages so the data is a little different than before. While before “under 18” was one, it’s now “18 and under” with each subsequent grouping being 5 year blocks. This data is absolutely skewed as 1) It is believed younger individuals don’t use Facebook as much in the past and have migrated to other platforms; and 2) Laws restrict what can be collected based on age, ie those under the age of 13 shouldn’t even have accounts. So, younger readers are absolutely under-counted.

Age breakdown of comic fans on Facebook January 2025

Relationship Status

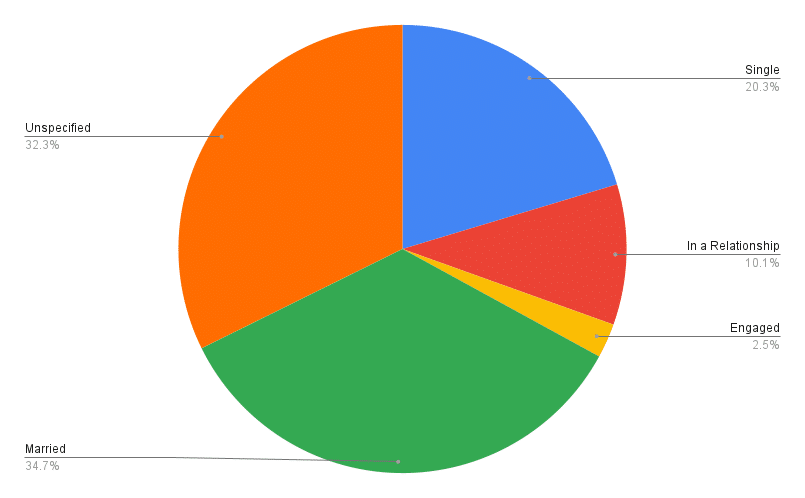
It feels like more are married now with the largest segment being exactly that and the second not reporting their relationship status. It could very well be a sign of an aging population of fans.

Relationship Status breakdown of comic fans on Facebook January 2025

New Stats!

Education has been combined to see how many individuals have at least a college degree. About 28.15 million fit that which means 28.72%. In 2022, 37.7% of the American population had at least a college degree.

14.2 million fans, 14.49%, are parents!

And finally, what’s the crossover with fans of board games and video games? 33.5 million, 34.18% of comic fans also enjoy board games. 59.5 million, 60.71% also enjoy video games. Get your licensing engines revving!

What’s Next?

All of this is a re-starting point. Things have shifted in how I’m collecting the data, like age, but it’s been quite a while since I’ve regularly done this. As we move along, we’ll start to look at trends over time.

There’s some legacy data I’m going to try and fill in so we can get a better sense of how things have shifted over time that will hopefully be available next month. And, part of that will be me trying to find the original data files from many computers ago. Lots of work so we can all have a better sense of where things stand! Until next time… what gets measured, gets done!
Comic and Graphic Novel Sales Boom in 2018 Reaching a Record $1.095 Billion

Comic and graphic novel sales reached $1.095 billion in the United States and Canada in 2018. That’s an $80 million increase over sales in 2017. Those gains are due to increased book channel and digital sales, as well as the inclusion of crowdfunding sales for the first time. This is all according to the yearly estimates report released by ICv2’s Milton Griepp and Comichron’s John Jackson Miller.

Sales in the book channel, which includes chain bookstores, mass merchants, major online retailers, and Scholastic Book Fairs, were up by double digits, with sales of kids graphic novels the biggest factor. Digital sales were also up for the first time in several years, with increased title counts across multiple platforms a factor. Sales in comic stores were down very slightly versus the previous year.

Sales of all three formats, comics, graphic novels, and digital, grew in 2018, with graphic novels leading the way, followed at some distance by digital and comics. The digital total does not include all you can read services.

This year includes a new category, “other.” This includes the Newsstand (periodical sales through specialty retail and mass merchant chains) and Crowdfunding (Kickstarter, etc.) channels. This year, those two channels each accounted for roughly half of the “Other” category.

Sources for the information include NPD BookScan, which collects weekly point-of-sale data on print books from over 16,000 locations including e-tailers, chains, mass merchandisers, independent bookstores, and more. NPD BookScan covers approximately 85% of the U.S. trade print book market. Some publishers classify titles that are primarily text, or art books, as graphic novels; we remove those titles from our analysis.

The analysis also incorporates information released by Diamond Comic Distributors, the largest distributor of English-language comics and graphic novels in the world, on sales to comic stores.

Information is also gathered from a variety of other sources, including publisher, distributor, and retailer interviews.

This is the sixth joint market size analysis from ICv2 and Comichron; the first was for 2013 sales.

The Comics Are All Right: The Truth is Out There, We’re Going to Find It

Call this a manifesto, a vision, but this to me is to get my thoughts about where I’m taking my writing and particularly this column. Launched two years ago, the concept of “The Comics Are All Right” was to give a data driven take on the comic industry. Much is written out there but much of it is opinion or shallow deep claims. Very little analyzes what’s underneath, really crunches the numbers without agenda, or takes a different perspective on things. That’s where this comes in.

There’s much been written and buzzed about lately about how the comic book industry is full of doom and gloom, a broken system that needs to be torn down before being corrected. So many digital pages have been spent blaming certain publishers without much context or deep dive into the what or the why of it all. The industry as a whole is presented as an over simplified problem with blame focused squarely on the main comic distributor Diamond Comics, and as a conspiracy by the big two, Marvel and DC Comics, to squeeze out smaller publishers making it difficult for them to publish or they’re to blame for all of the woes.

The reality is further from the truth.

The reality is, it’s complicated.

The comic industry has issues, don’t get me wrong. From publishers and creators through distribution to stores and fans, everything can be improved, but that will always be the case as marketing, business, technology, and more evolve.

I’m about data and coming up with solutions. I’m returning to this weekly column looking at the reality of the comic market both good and bad, and offering actionable solutions, not just griping. Any claims will be backed up with facts.

You won’t fine claims like “Marvel is sinking in sales and destroying the industry” without a hard look at the numbers not just this year, but decades past, and more importantly how that compares with other publishers or even other years. When we discuss the sales of each month we’re going to go beyond the percent of the market. We’re going to challenge the “wisdom” that pervades the industry.

And most importantly, there’s no agenda here.

I don’t have it out for any publisher, I want them all to succeed. But, we’re not going to pull punches and most importantly, we’re going to let the data take us to wherever it does. This may back up beliefs from the chattering class. It may contradict that. But, what we’re going to absolutely be doing is providing the hard numbers and data to back up any claims we make.

This’ll be interesting and I’ve been gathering the data to set us upon our journey in the next column for some months now and have no idea what I’ll find. What I know is, it’ll be based in reality, not opinion, and it’ll actually ask the tough questions and speak the truth about where the industry has been and where it’s going.

I’ll be back next week with the first real entry for this column with a beginning dive into the year that was.


The Comics Are All Right: A Cover Price What If?

In last week’s “The Comics Are All Right” I explored that the reason for the recent nervousness in the comic industry and stores could easily be explained by the drop in “weighted cover price” for the top 300 comics.

For those that haven’t read last week’s column, as reported so far Comichron:

  • All Unit Sales For Diamond Comics increased by 1 million
  • Unit Sales for Diamond Comics Top 300 Comics increased by 180,000
  • Unit Sales for Diamond Comics Not 300 increased by 820,000

So, more comics were sold. HOWEVER:

  • Dollar sales for all Diamond’s comics decreased by $6 million
  • Dollars sales for Diamond’s top 300 decreased by $8.9 million
  • Combined dollar sales for Diamond’s top 300 comics and trade paperbacks decreased by $5.22 million

While more units were sold, less money was coming in. WHY?

The weighted average price for Diamond’s top 300 comics decreased by 11 cents.

If we assume shops aren’t sitting on a ton of excess comics that aren’t being sold (and judging by monthly reporting of the estimated number of comics ordered, that’s not the case), the yes the problem shops are facing is that the top 300 comics aren’t bringing in the dollars that they were in 2015. Yes, it really is that simple.

In 2015 the weighted average price for a top 300 comics was $3.96 a 17 cent increase from 2014, while the top 300 comics average price was $3.85 in 2016 which is an 11 cent decrease.

I’m a big fan of Marvel’s comic series What If? and decided with this knowledge to play a little “what if” of my own.

“What If? 2015 Saw the Same Average Weighted Cover Price as 2014?” and the sequel “What If? 2016 Saw the Same Average Weighted Cover Price as 2015?”

Here’s the stats:

what-if-stats

As you can see, there’s a big difference. If 2015’s average price was the same as 2014’s there’d still have been an expansion in dollars sales, though not as much as there was in reality ($15 million less to be precise).

2016 is a totally different world. Instead of being a $8.9 million decrease from the previous year, we actually see dollars in increase by $15.871 million if cover prices remained the same (a $24.771 million swing).

We don’t know how many shops there are in the US, but here’s the possible gains.

what-if-gains

Instead of a loss, stores gained a significant amount of money in this scenario. Now, there is a flaw in this thinking in that most likely the units sold would not have been the same, they’d have likely decreased. But in this scenario, we’re keeping it as if everything else remained unchanged.

While 11 cents might not seem like a lot, you can see how much of a difference that can make. Cover prices do matter, and they matter… A LOT!

The Comics Are All Right: Is It Simply the Cover Price?

It’s time for some fun with math! There’s a lot of worry from comic shops about their viability and speculation that 2017 will see mass closures of local comic shops.

Comichron has some stats for 2016 already listed, so I thought it worthwhile to see how the year compared to 2015 with the data we have so far.

What’s reported so far is Diamond Comic Distributor’s estimated sales. Diamond is the primary distributor for comic shops, so this is some of the prime data that we’d want to look at to see the “health” of hoe shops are doing. Again, I stress as I always do that this data are estimates and not perfect in any way.

diamond-data-2016

But what’s the year to year like? Below we see the gains and losses for 2015 and 2016.

diamond-data-2016-year-to-year

That’s a bunch of red in 2016 compared the 2015.

  • All comic sales are down
  • The Top 300 is down
  • The combined top 300 comics and TPBs are down
  • The average price of the top 300 weighted by orders is down

It’s not all bad though.

Comics not in the top 300 increased compared to 2015 selling 820,000 units more. Trade paperbacks too saw a massive increase in dollar sales.

Unit sales have increased as well.

  • All comics increased by 1 million units from 2015
  • Top 300 comics increased by 180,000 units

Trade paperback sales are up. Non top 300 comic sales are up.

The problem is pretty clear from the data, even though there’s more comics being sold, they’re returning less dollars, and there’s two data points that backs that up.

Dollar sales for the top 300 comics is down nearly $9 million and add in the 11 cent decrease in cover price the picture is obvious. More is being sold at a lower price which is causing a pinch of dollars.

It’s unknown exactly how many shops there are in the United States but estimates has it between 2,000 and 3,000 shops. $9 million split that way equals some serious dollars.

shops-loss

That’s a lot of money per local comic shop that’s vanished. Take into account some shops are doing well, that means there’s potentially a bigger loss for other shops. Those numbers above represent a month’s rent at least for some shops gone. Even with margins, these numbers show shops absolutely should be feeling a money pinch compared to 2015 and that there’s something there to correct.


The Comics Are All Right: Does Increased Economic Confidence Mean Lower Sales? A Year in Stats.

For those who might not be familiar with it, Comichron is an interesting resource for data on estimated and reported sales figures in the comic book industry. Run by John Jackson Miller, the site is a great tool in trying to suss out trends and patterns and while there are flaws, it’s also one of the best resources we have.

With 2016 over and the December estimates up I decided to check out what might be discerned from what Miller has reported and what stands out to me.

Comics Outside the Top 300 Ended the Year Strong

While Miller doesn’t seem to report this stat for most of the year, in August he began to not just report the estimated number of comics in the top 300 shipped, but the total number of comics shipped by Diamond.

Using that data, we can look at how many comics that weren’t in the top 300 that were shipped and it looks like they ended the year rather strong accounting for almost 10%. While the overall sales for Diamond and sales of the top 300 comics looks to have dipped since August 2016, the percent of indie comics that shipped increased.

2016-non-300-vs-sales

We also see this trend through the year as the comics not listed in the 300 increases as part of the new comics shipped each month (though there’s clearly volatility in comics ordered).

2016-not-300

As the year goes on it looks like shops began to look elsewhere for sales as they began to order more comics not in the top 300 chart. This could reflect the narrative we’ve seen floated by sites and shops that the selling power of the big two has waned and they’re looking to make up for those decreased sales.

The Non-300 is an Impressive Amount of Money

Miller provides a few interesting dollar stats in his monthly reporting. There’s the “Top 300 Comics Shipped (in dollars),” “Top Graphic Novels Shipped (in dollars),” “Top 300 Comics plus Top GNs Shipped (in dollars),” and “All Comics and GNs Shipped (in dollars) and that latter was also previously labelled “Overall Diamond Sales (including all comics, trade,s, and magazines).”

So, I decided to see what those dollars were that weren’t the top 300 comics and top 300 graphic novels. The answer, an impressive amount. But, that amount looks to be trending down. For as much focus as there is on the sales of graphic novels/trade paperbacks and comics, this “gray” area that includes those outside the top 300 and magazines is often overlooked. For 2016 the top 300 graphic novels was relatively flat for the year and the top 300 comics, while all over, increased over the year too. But, that “everything else” while initially seeing an increase looks to start decreasing about 3/4 of the way into the year. Is the problem for local comic shops actually this?

2016-sales

Is it the Confidence in the Economy?

I don’t know where I first came upon this tidbit, or even how true it is, but it’s believed that board game sales and video game sales do well in down economies. You can read up on some of this.

This is one I definitely want to track going into 2017 and go back for data in 2015, but I used the US Economic Index released by Gallup and compared that to the reported sales by Diamond.

While things are a bit all over for the year, we see the Economic Index begin to increase in August and skyrocket in November, this is about the same time we see the sales number dip. Could the recent worries by local comic shops be due to an increased confidence in the economy? Stay tuned as we continue to track this.

2016-economic-index

The Comics Are All Right: Build Your Own Community

I began these articles last year to move some of the discussion surrounding the state of the comic industry away from “opinion” and “anecdotes” and towards facts and data. You can check out what I’ve written before but beyond looking at sales data, the goal is to also look at other data available such as analytics, Facebook demographics, and also talk to creators directly to see what does and doesn’t work.

For this new year, I felt it good to focus on at least one best practice for publishers and creators, building an email list and social networking presence, your own community. But, beyond just going over “how to’s’ as far as building a community or why it’s a good idea, I thought I’d take a different spin and see what we can learn from the data available and answer a question:

What’s the overlap of “fans” of publishers?

There’s no way to really figure out if the folks who purchase comics are loyal to one publisher, many publishers, or maybe a select few. “Sales” data reported is estimated sales from distributors to stores, we don’t know what stores sell directly to customers, whether it’s physical or digital sales.

So what can we look at to figure this out?

First, there’s Facebook data. Twice a month I report on data derived from Facebook looking at the demographics of those who “like” comics. But we can do more than just report on the age, we can also see how many people like two different pages, publisher a AND publisher b.

What I’ve done is look at the amount of US likes a publisher has (I’ve also included Amazon and comiXology because more on that below and why these particular publishers are explained as well) and then also looked at how many likes those two pages shared in the US. Below is the results in percent and I think the results are really interesting.

us-publisher-overlap-1-2-17

To read an example 61.90% of comiXology’s Facebook “likes” also “like” Amazon. We can see the percents vary greatly, but what stands out to me tis that the overlap is not as much as you think. This isn’t the same fans liking a bunch of different publishers, it’s clear that in same cases some publishers have really built a niche and audience all their own.

One data point is nice, what about two?

Well, this is how this thought exercise began. My day job is working in email and monitoring deliverability, trends, spam, really boring stuff. But, this also gives me access to see how email programs are performing (opens, clicks) and also how much email lists overlap! So, what do we see when it comes to email lists?

us-publisher-email-overlap

The above were chosen to start because they’re all publishers or platforms I regularly get email from and signed up for (I’m particularly fascinated by Amazon’s email program). So, at some point this will all expand, but you need to start somewhere. Amazon’s emails are impressive and they do at least one weekly email for fans of comics, that in particular is why I’ve watched them. But I digress…

What above represents is how many people are on each list. For example 38% of Valiant’s list is also on comiXology’s. Again, like Facebook we see that the overlap varies and that generally people aren’t signing up for everyone. Valiant’s percents are particularly high due to a smaller list size.

So what does this mean?

It means that each of these publishers have a captive and unique audience for them to talk to. They have people who clearly care about them to pitch their releases each and every week. It’s as simple as that. As a publisher, a creator, you should be doing everything to build your community, because from what we see above, that community is probably pretty unique and want to hear from you, and possibly just you!

So, here’s a resolution publishers and creators should be making this year, build your community! Then use it to sell some comics!

The Comics Are All Right: The Power in Data

comic-unit-sales-not-300The point of the “Comics Are All Right” articles are to do a couple of things, but most importantly give a more analytical data driven approach to the comic market. The first article discussed the reality of the comic market and what the few numbers we know tell us. The second attempted to define what exactly the comic market is.

While both paint a more positive look at the comic market, that doesn’t mean there aren’t places for improvement.

This third article begins to dive into that and more importantly how data can be leveraged to expand the buyers, the fans, the buzz.

If you work for a publisher I want you to ask these questions:

  • The average age, gender, income, education, ethnicity of my readers are?
  • My readers live in ____?
  • My readers also like to purchase ____?
  • My readers also read ____?

Now ask those questions for each title you sell.

I’m sure a lot of you answered, “I don’t know.”  There’s nothing to be embarrassed about that, partially due to the fact the comic industry just straight up lacks a feedback loop to get information back. Publishers sell to distributors. Distributors sell to stores. Stores sell to individuals. Very little information goes back up the chain. The loop is broken.

Now, imagine a different scenario.

Publishers sell to distributors. Distributors sell to stores. Stores sell to individuals and get the information they can at the point of sale and that information is then returned back to the distributor and publisher. Imagine what that opens up.

Better targeting of marketing. Knowing who is purchasing and thus being able to better find look-alike individuals. Knowing what stores are underperforming so that help can be provided. Knowing what areas could benefit from a tour of individuals. Knowing sell-through, how long things are on shelves, the list goes on and on.

Information is Power

2016-09-20_1507I work in politics. Based on certain information (age, gender, income, education, etc.) I can figure out if you’re likely to vote, vote for my candidate, support my cause, donate money.  We have targeting and micro-targeting down to a science and here’s a bit of how we do it.

If you don’t believe the above statement, stop reading now, because you will fundamentally disagree with my point and my pitch. In Democratic politics we have some major databases, a national voter database and data warehouses.  That national voter database is a first stop for many campaigns. It has the voting history of voters in America.  I can look you up and tell you when you’ve voted, what primaries, and with a little bit of information and looking at your history I can predict how likely you’re going to vote. Imagine taking that voter information but combining it with purchasing data, demographic data, whatever you’re willing or unknowingly giving.

Through those two databases, and a little legwork, data models can be created to figure out who supports candidates and causes and the likelihood of individuals to vote or give money or take action. Through that information, I can then target accordingly with the right ask and right message. If I know men who are part of the NRA, drive pick-up trucks, and read Maxim are unlikely to vote for my candidate, I won’t spend money to court them. Also, if a group is more than likely to vote for my candidate I’d seek those individuals out and more importantly individuals who are like them and target my outreach to them.

The first question the comic industry needs to stop and ask is not who do I want to target, but who is currently reading? The above is a simplified version of what occurs, but I can predict elections down to percentage points.  Imagine the power of the above for marketing comics?

The Data

2016-09-20_1506As I stated above, the needed feedback loop to really get the information needed is lacking in the direct market. But, information can be gleaned from elsewhere. Facebook, website traffic, Twitter demographics, can all be leveraged to find individuals who will likely support your comics. They’ve shown interest by seeking you out already.

Digital comics have the greatest potential to spark this data revolution. With each digital purchases data is directly gained such as the frequency of purchases, what is purchased, and potentially even how much is read. Email addresses unlock a treasure trove of data as it can be used to append commercial data. At a 30% to 40% match rate you can know the gender and age of purchasers for instance. You can know if they’re parents, own a home, their estimated income, and more. One particular data vendor I’ve worked with offers over 250 data points that you can begin to append for just change a record.

That data becomes powerful when used for marketing. If you know individuals regularly purchase certain comics you can make that comic front and center in your marketing emails. You can tailor images to the individual, for instance showing women’s or men’s sizes based on the gender data you’ve appended. And, if you notice one particular segment is more likely to buy a book, you can then find more people like them and market that specific book to them.

While this might seem like a herculean task only available to the biggest of publishers, this is something the individual creator can do if they want.

And there are absolutely differences between publishers. Marvel fans enjoy Call of Duty, Xbox, and Playstation far more than DC Comic fans. None of that ranks high for Image fans. Marvel fans enjoy the UFC, NBA, WWE, and NFL compared to DC’s NBA, WWE, and UEFA Champions League. Image fans just enjoy the NBA apparently. Should Marvel advertise to the UEFA? Should DC advertise to the UFC? According to this, that’s not the best strategy. Image might find success by teaming up with the NBA from what I see. For very little investment you can test these things to see what works for you.

I gathered the above data differences for free in five minutes.

The Pitch

2016-09-20_1510The Democratic and Republican parties have something of what I’m about to describe. There’s numerous parts to this and I’ve laid it out to some folks who don’t seem to see the big picture.

1) National Database – Someone needs to do it.  A database that goes from the publishing level down to the store and blog level. Data can be appended and a good idea of who is purchasing can be truly known. Data can be walled off, but general data/demographics would be made so that everyone can gain.

People like telling you about themselves. Through questionnaires or even appending the data through purchases you’ll know you is buying what. All it takes is an email address to start believe it or not. When following up asking for an email address with a survey, online I got high 70’s to low 80’s conversion to filling out the form, with pretty personal questions.

2) Universal platform – Imagine a national platform. A national database of comics. A website in a box. All tied into the above database. The proposed would tie in weekly releases, sales, stock management, ordering, bloggers, website capabilities, and most importantly ways to capture data. Blogs would have community tools, stores would have stock management and websites, and all of that data would trickle up eventually to the publishers. Better targeting, printing and shipping would occur since the data is real time and real customers.

Those two items can be implemented tomorrow. But the above is just the tease.  I’m not about to lay it all out there for you, I need some secrets. The bells and whistles are held close to my chest, but hopefully you get the idea.

Imagine knowing who buys your comic and where those people really live. You can better advertise, send artists and writers to events, schedule promotions. As publishers and creators you’d be able to grow your business and sales intelligently. Stores would be able to use the information and tools to better keep in touch with customers, find new ones and easily promote themselves.

A win – win situation for all.

When I described the above to a few folks I’ve been told “It’s been tried before” or “it’s too complicated.”  The response to that is bullshit. It may have been tried, but when was it attempted? Who were involved? What technology was used? If you can get entire parties to subscribe to versions of the above, an industry can do it if they have the will. It’s just who wants to opt-in and gain and who wants to sit on the sidelines and fade to obscurity.

What is needed

It all comes down to vision and leadership.  Instead of bitching about sinking sales and what genders may or may not be reading, we as a whole should figure out who is reading and how to reach more people like them. We should be focusing on the right questions to ask? We should stop rehashing the same convesations we’ve been having for decades. It’s about a vision forward. Now, who wants to take up the cause and lead?

The Comics Are All Right: The Truth is In the Numbers

There’s much been written and buzzed about lately about how the comic book industry is full of doom and gloom, a broken system that needs to be torn down before being corrected. It’s presented as an over simplified problem with blame focused squarely on the main comic distributor Diamond Comics, and as a conspiracy by the big two, Marvel and DC Comics, to squeeze out smaller publishers making it difficult for them to publish. The reality is further from the truth.

The comic industry has issues, don’t get me wrong. From publishers and creators through distribution to stores and fans, everything can be improved, but in reality that will always be the case as marketing, business, technology, and more evolve.

I’m about data and coming up with solutions. I’ve decided to begin a weekly column looking at the reality of the comic market both good and bad, and offering actionable solutions, not just griping.

I thought a good first place to begin would be with the actual numbers and where the industry lands. All of the numbers presented are based on the estimates reported by ComiChron, an excellent website to check out if you’re a data geek. I want to emphasize these are estimates though, something I’ll tackle later on, and begin by saying when numbers, especially the sales numbers, are used as fact, we begin our argument on a weak footing. What I like to think of this as is trends, not hard numbers.

Myth #1: The Industry is Decreasing in Sales

I remember the 90s comics driven by crazy covers (that got crazier as months went on) and driven by shock events. There was quality, but you had to dig for it. I myself began to work in comic shops around 1996 a time I absolutely loved and I had the responsibilities of ordering, estimating what we’d sell, and more. It was tedious then, before computers made things a bit easier. I remember also comic sales dipping as the comic crash caused by numerous factors occurred (a topic for another article).

At its height in 1993, it’s estimated there were $850 million in sales with a bust that continued until roughly 2000 when the industry dropped to $275 million, a drop of 68%. But since 2000, the industry has seen pretty consistent growth with estimated sales of $1.03 billion in 2015 (including digital) and $940 million in just print. That’s almost $100 million more in print than in 1993.

sales-estimates-in-dollars

Myth #2: That Increase is Mainly Due to Increased Cover Prices

This one is sort of true. We can see from 1991 that the average cover price of comics has steadily increased.

comic-cover-prices

If comics had followed inflation the average comic which was about $1.78 in 1991 should only be $2.79 in 2015. In reality, things were about $1 higher.

And units did decrease. It’s estimated that 130 million units were sold in 1996 dropping to a low of 66.9 million in 2001. Today, things have improved with 2015 seeing the most units sold since 1997.

comics-unit-sales

Myth #3: All of Those Units are Major Publishers

The above data of units is what is estimated by Diamond. There’s lots of different distribution avenues now for comics and graphic novels that are not reflected in the charts people are all too quick to quote. Raina Telgemeir’s three graphic novels have over 3.5 million copies in print as an example. Add in Kickstarter, webcomics, Etsy, Patreon, selling direct to stores, and more, and all of these numbers quickly fall apart.

But, the argument really is that the direct market and Diamond have been a hindrance for small print comics. Well, the data would beg to differ.

ComiChron estimates the top 300 comic unit sales and the overall comic unit sales, those are represented by the orange and blue lines. The difference between those numbers should be comic sales that aren’t in the top 300, we can call them 301 and up. Using those numbers we see a steady increase in unit sales of those not in the top 300 represented by the gray.

comic-unit-sales-not-300

Since 2009, those unit sales have gone from 3.5 million to 8.8 million. That’s over 100% increase. While I can’t verify all of those are indie/small publishers, we can see this sector is growing, and growing steady.

Here’s that little gray line blown up.

comics-not-300

During this same time period, the top 300 comics saw a 19.08% increase. The non-300 saw a 150.85% increase. The direct market is working against those books? The numbers beg to differ.

Overall, doom and gloom? I see an industry on the rise after a crash and correction and while it has faults (which will be discussed in future articles), right now it’s showing slow and steady wins the overall race.

In the next article, I’ll discuss the actual distribution of comics and how it’s evolved over recent years.

« Older Entries Recent Entries »