Demo-Graphics: Comic Fandom Sees More Growth in September
Demo-Graphics is back with its seventh entry for 2025 (plus some bonus features)! Demo-Graphics was relaunched because the question still remains… who are comic fans?
What is Demo-Graphics?
Each month I dive into data from Facebook looking at the various demographics it can tell us about comic fans. This isn’t hard numbers, purchasers, or “Wednesday warriors,” but best used to show trends in the industry and the potential of the market out there. This has shown the shift towards women being a major force in readers and a shift to the younger demographic.
How does it work?
We use key terms, “likes”, that users have indicated and have come up with our own set to measure each month. There’s over 50 terms used (and no I won’t release them). We stick to specific terms for the industry such as “comics” and “graphic novels” and “one-shots” as well as publishers and leave out broad terms like specific characters or stories. Just because someone likes Batman doesn’t mean they like comics.
Other things to know…
This data is important in that it shows who the potential comic audience could be. These are not purchasers, these are people who have shown an affinity for comics, are potential purchasers, and those with a clear interest.
Also, with this being online/technology, due to laws and restrictions, those under the age of 13 are underrepresented.
Since the last time this feature was run, Facebook has made adjustments as to what it can report so some data is no longer available and we’ve also added in new data that hasn’t been reported before, and it now presents the data as a wide range. I’ve taken the average of the range. So, if it’s presented as somewhere between 500 and 1,000 people, the number would be 750.
So, let’s kick off the latest entry with the big question…
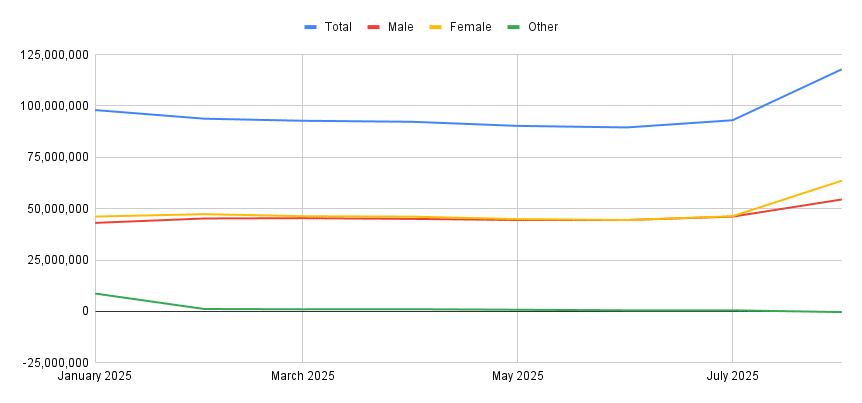
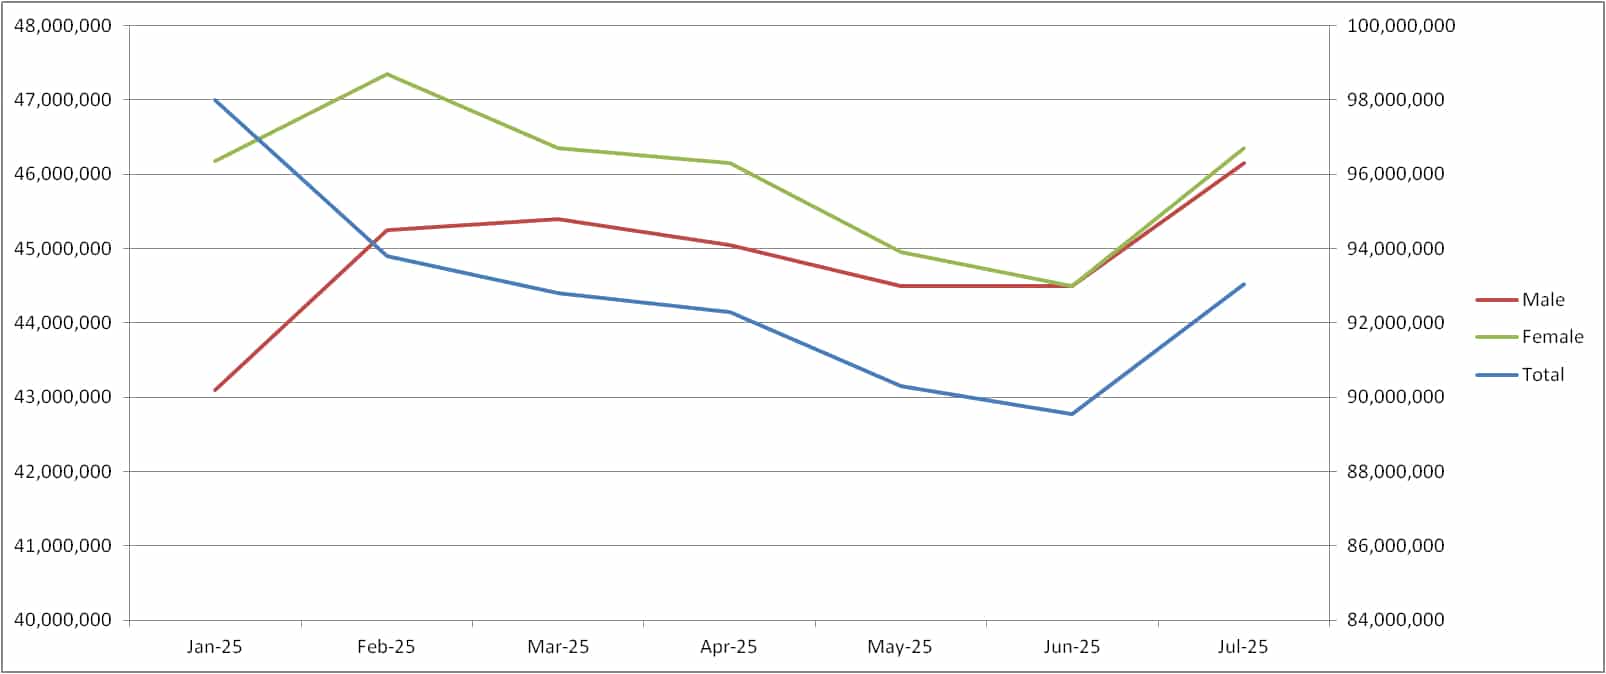
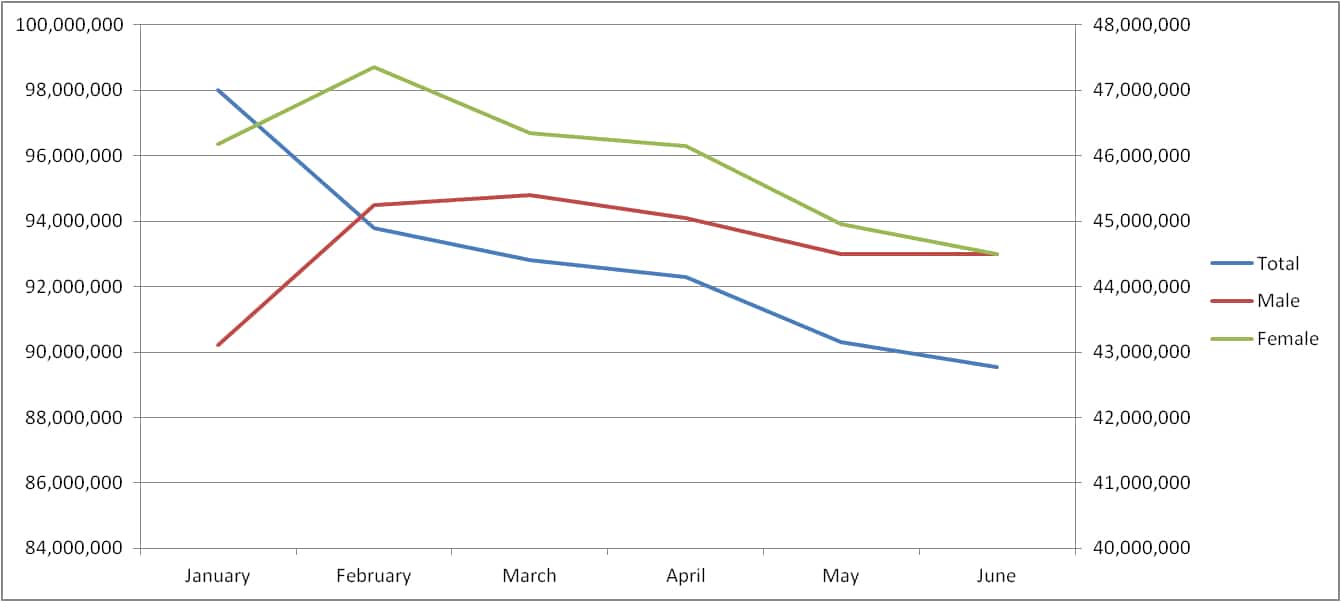
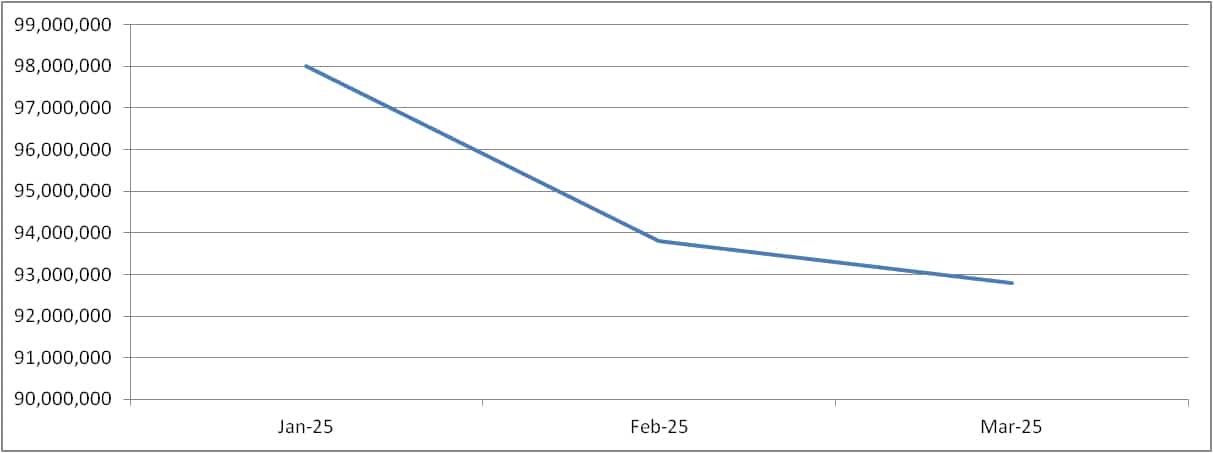
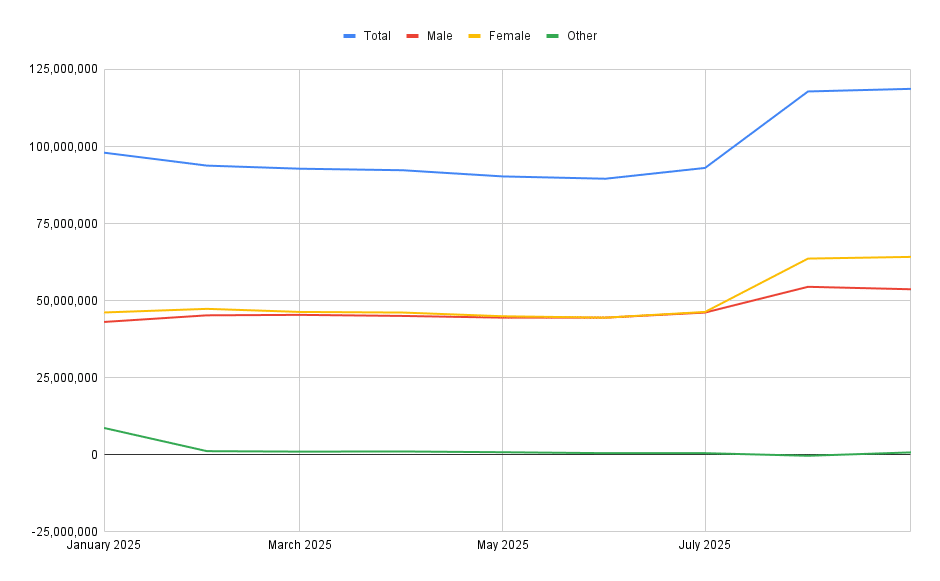
Facebook “Comic Fan” Population: Around 118.7 million in the United States
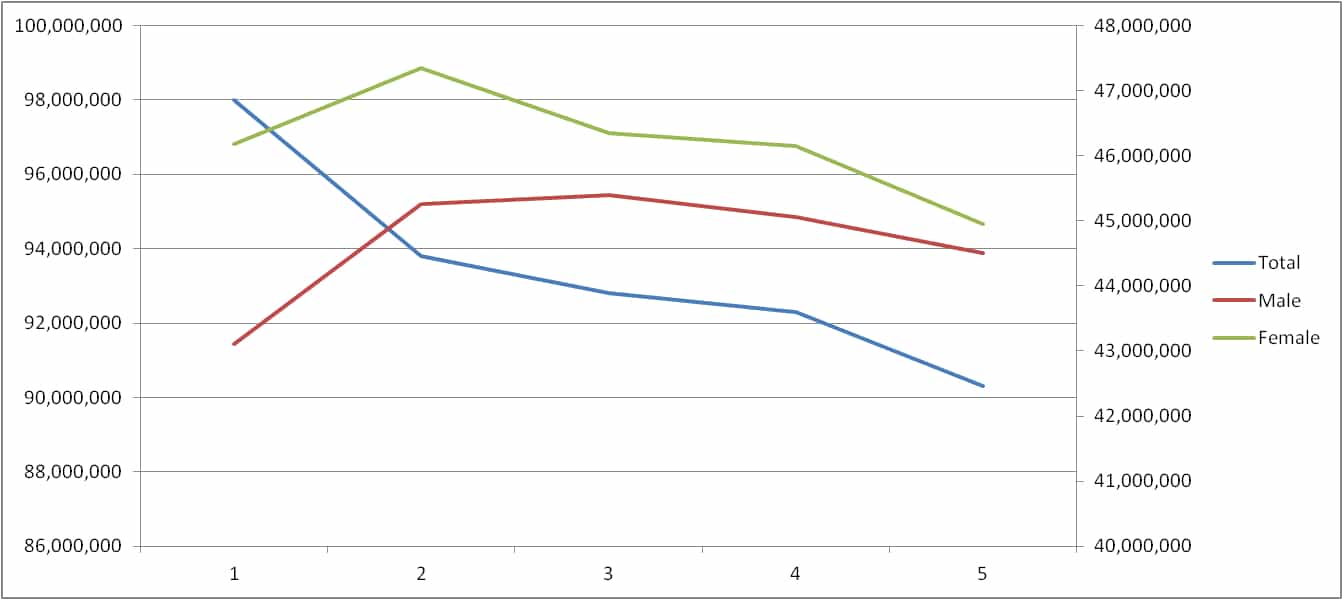
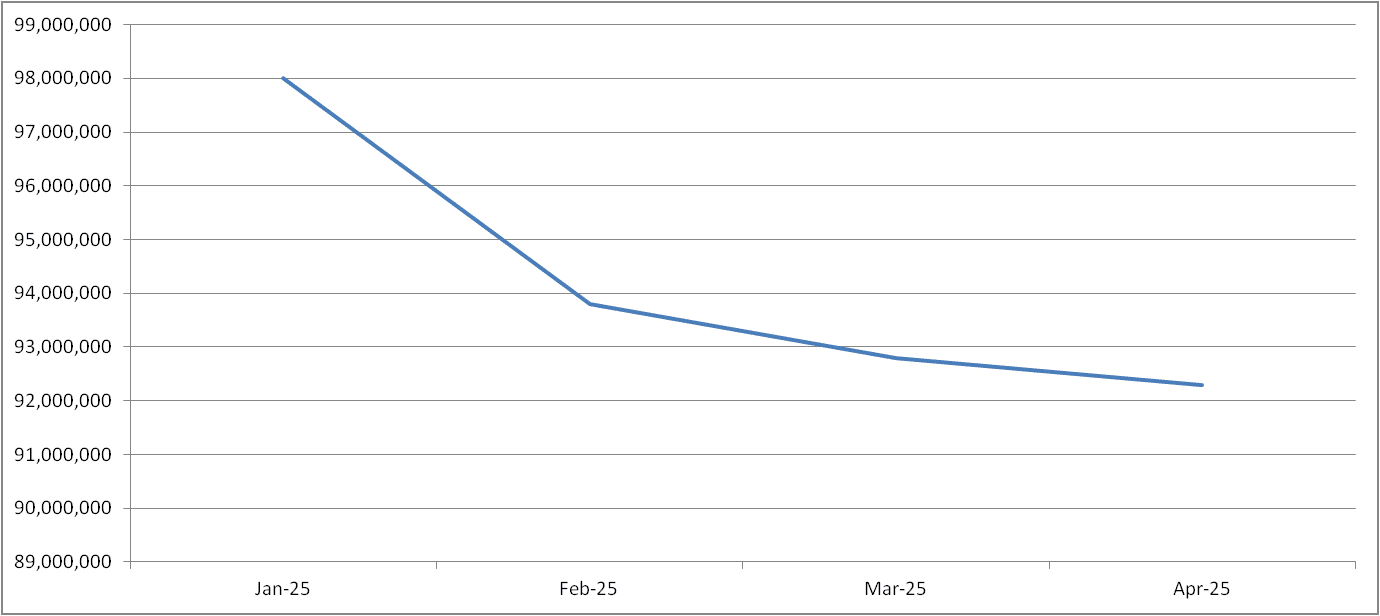
The first half of 2025 was off to an interesting start as we saw a decrease in the overall population for five months in a row. From January 2025 to June 2025, there was a loss of 8.45 million individuals. But, July stopped the slide with an increase of about 3.5 million individuals. August saw a jump of 24.8 million individuals while Facebook in the United States saw a decrease of about 500,000 individuals. September saw another bump of 850,000 while overall Facebook population increased by 2.2 million.
It’s unknown exactly why there was such an increase but it’s a possibility the algorithm picked up individuals interested in Superman and Fantastic Four due to the movies. While there’s some granularity in the search, it’s no longer like it was when we first ran these reports where we could absolutely avoid individual characters. We predicted this when we ran July’s report. We wrote then:
There’s many guesses as to why there was an increase, the release of Superman could have increased habits that Facebook would label individuals as “comic fans” because. With a similar start to Fantastic Four: First Steps, it’s possible August will see another increase.
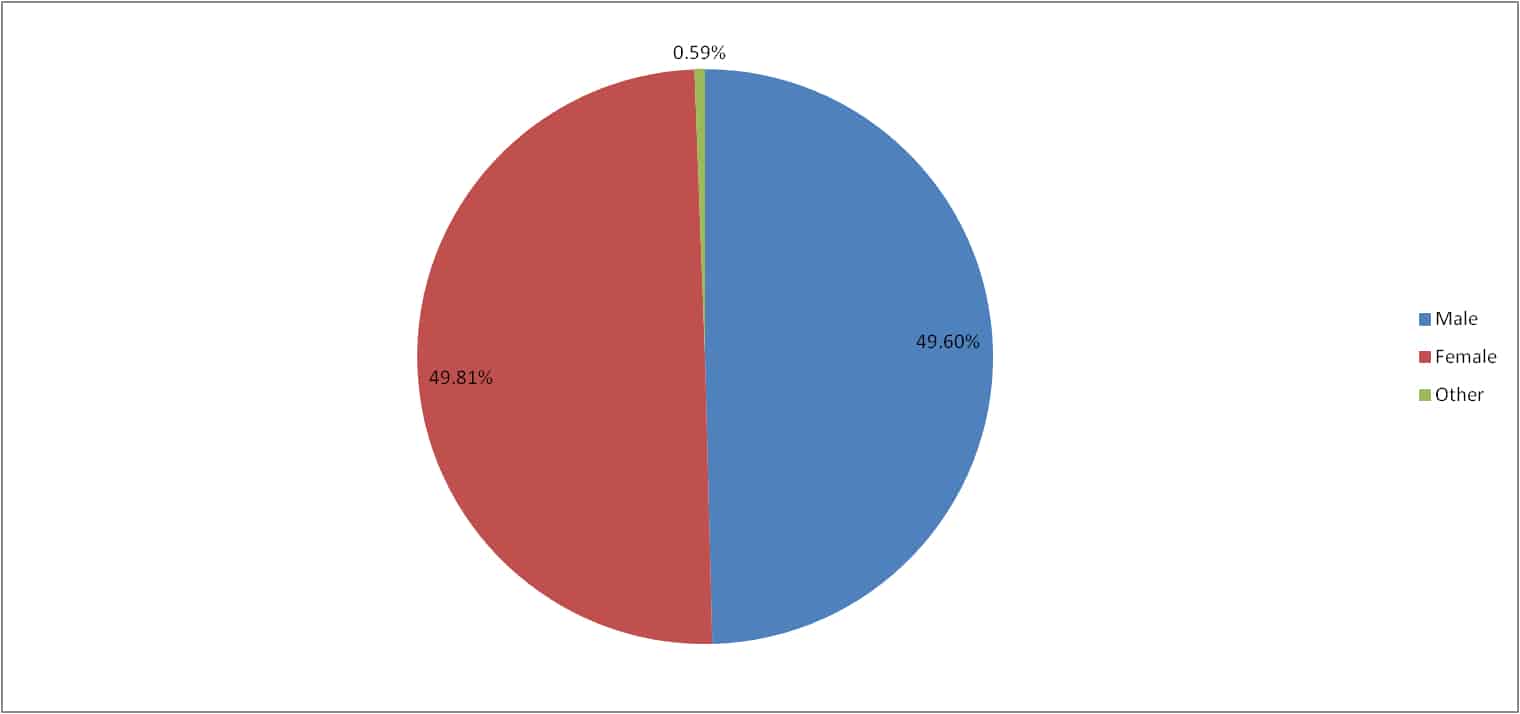
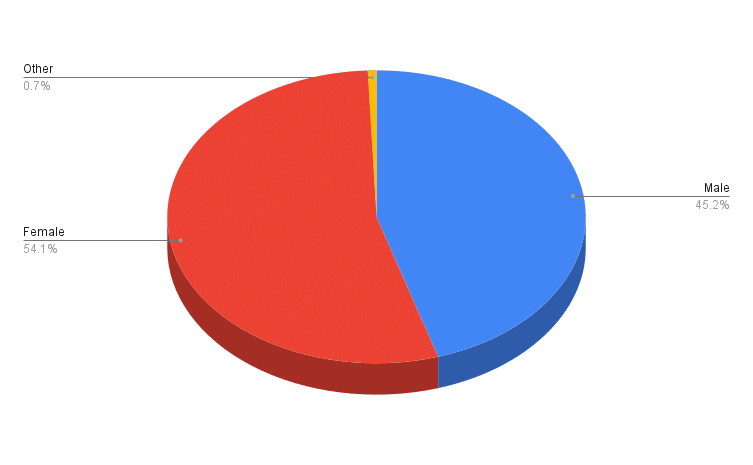
This month’s growth is interesting though. Men decreased in population size by about 800,000 while women increased by 550,000 and those not listing gender is now 800,000.
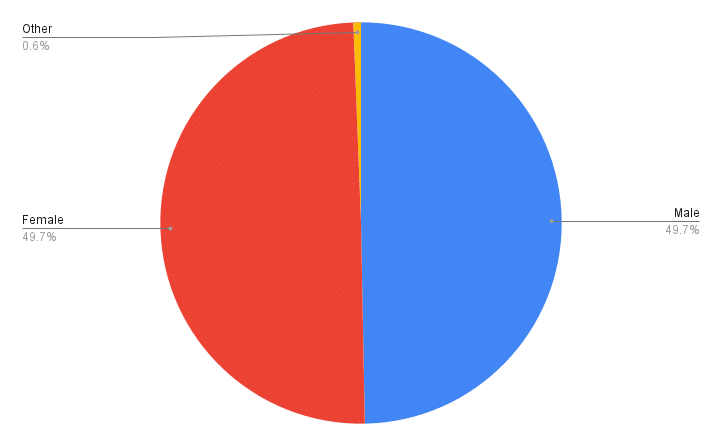
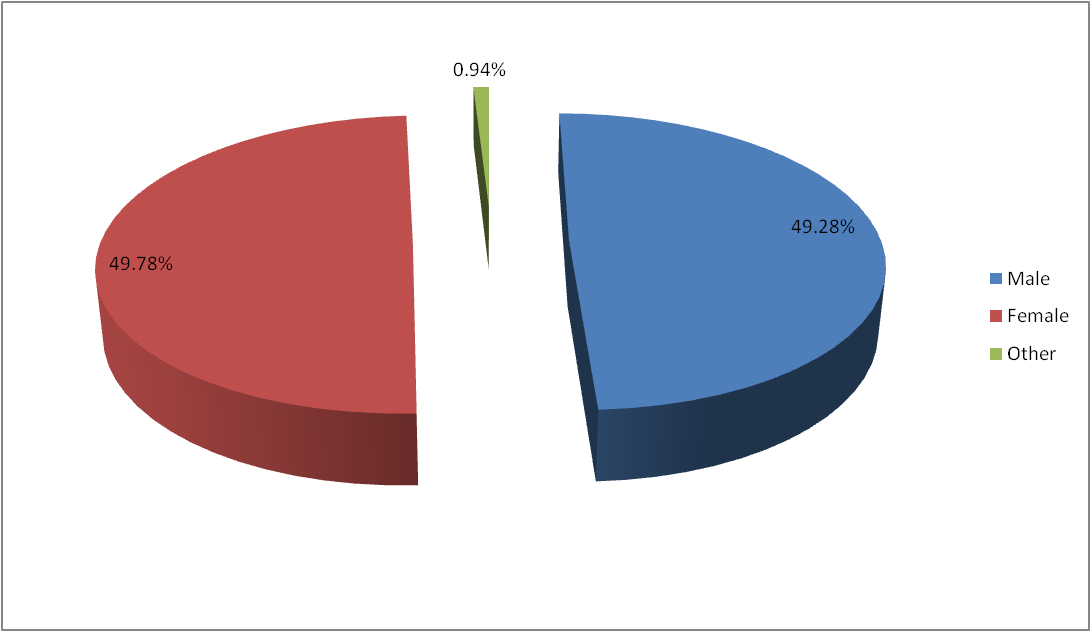
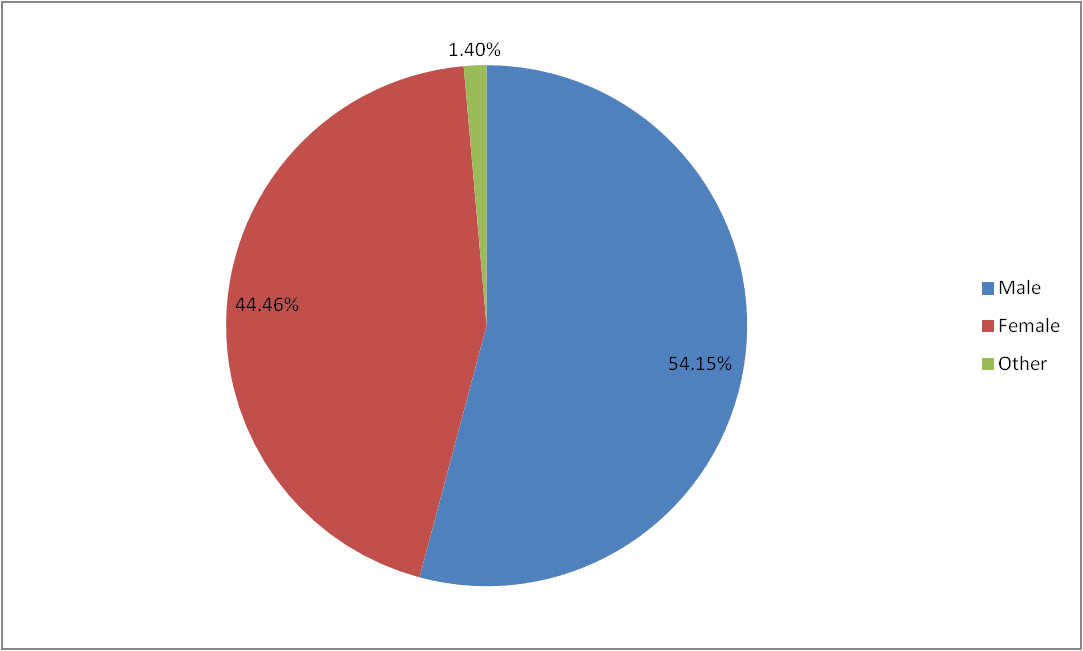
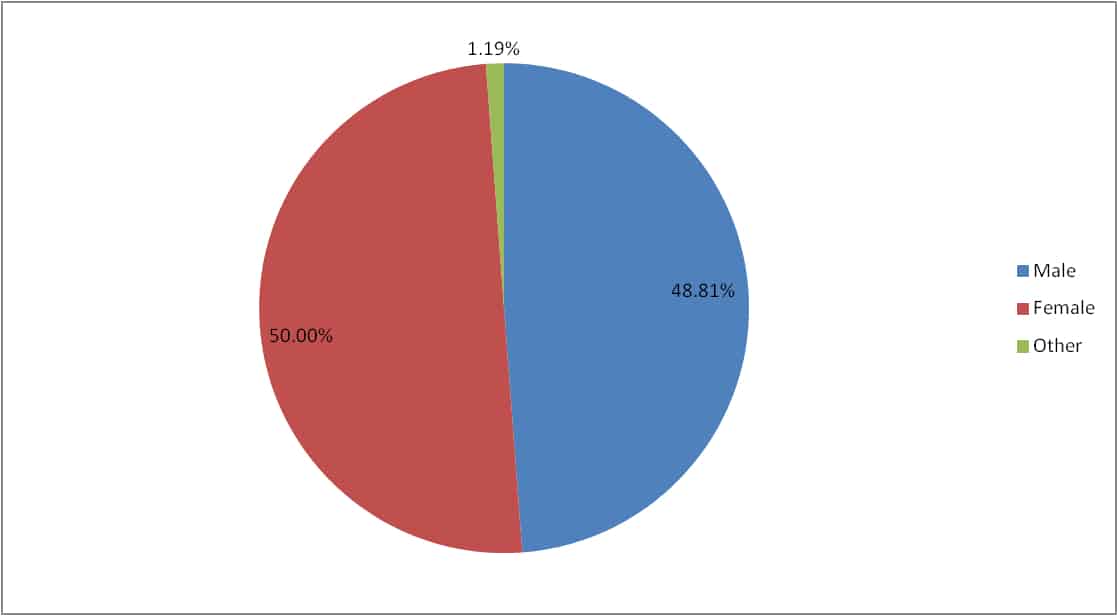
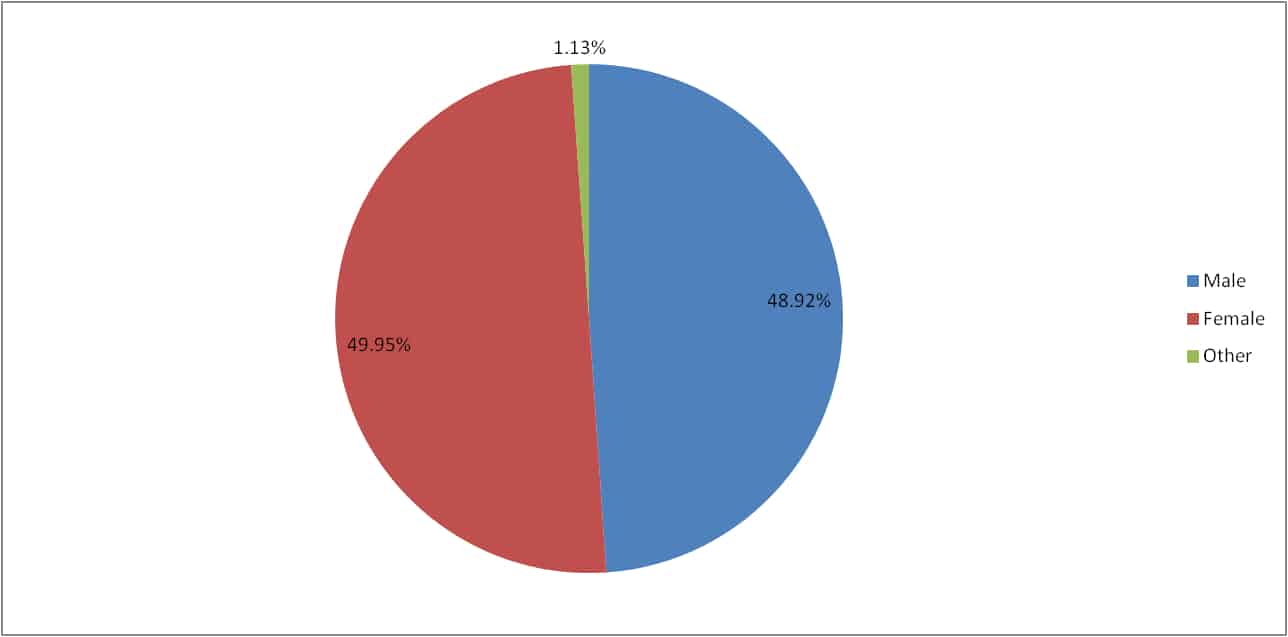
Gender
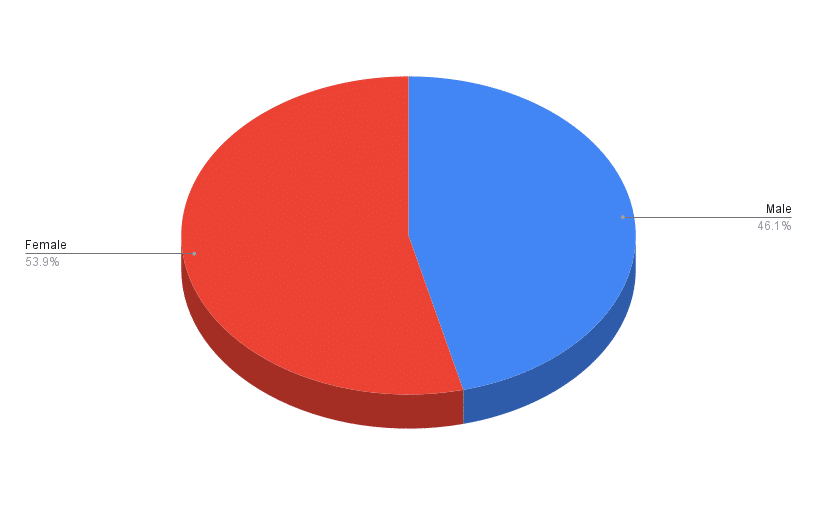
Last month, women jumped to 54.01% of the population. This month saw a slight uptick of that group to 54.1%. Men decreased in population size by about 800,000 while women increased by 550,000 and those not listing gender is now 800,000.
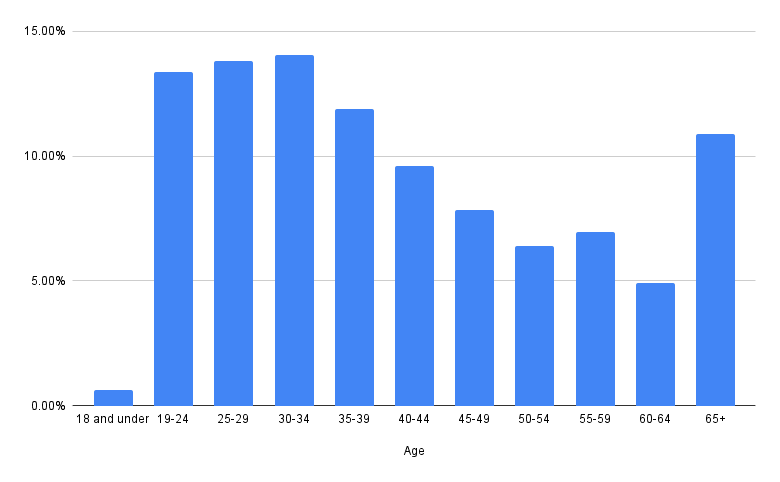
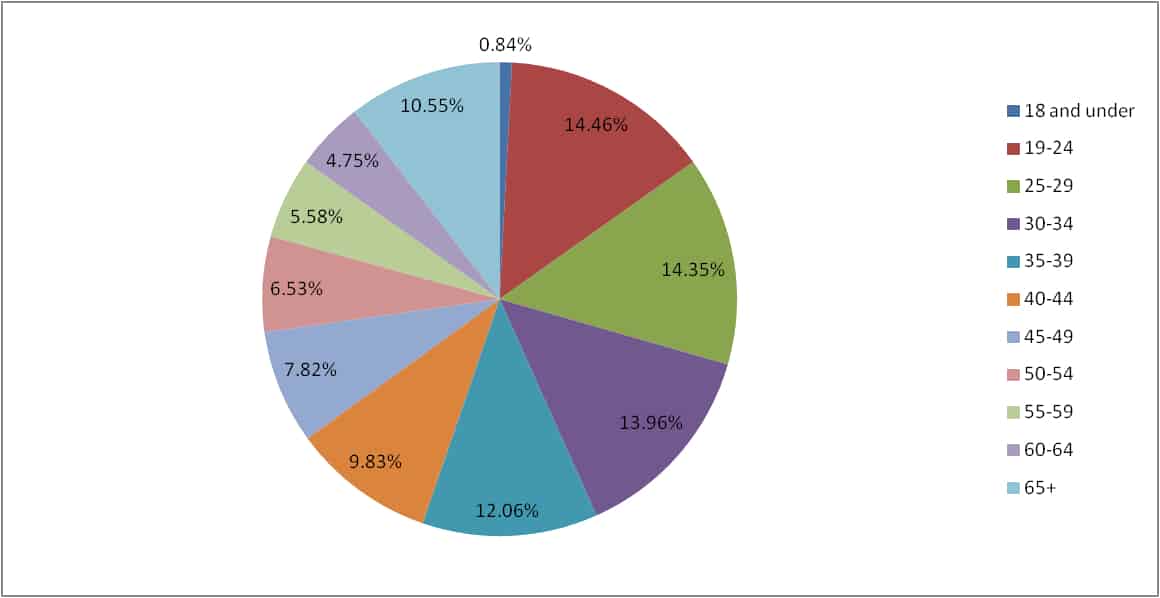
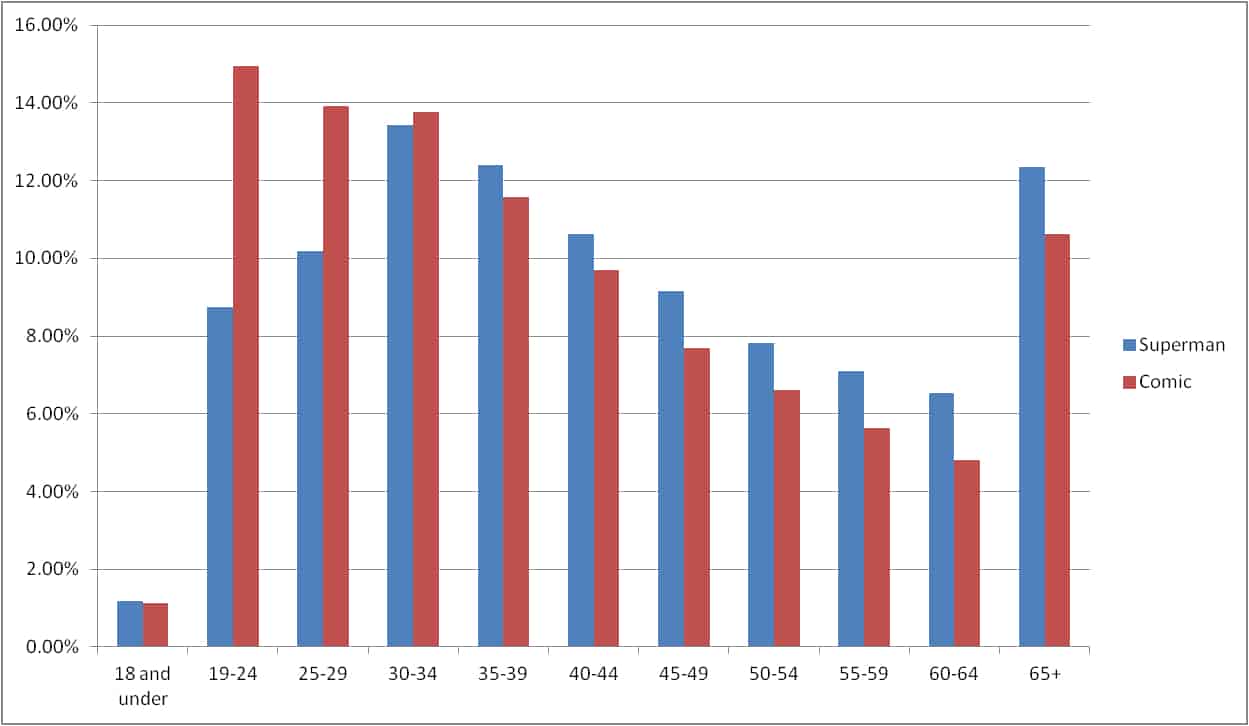
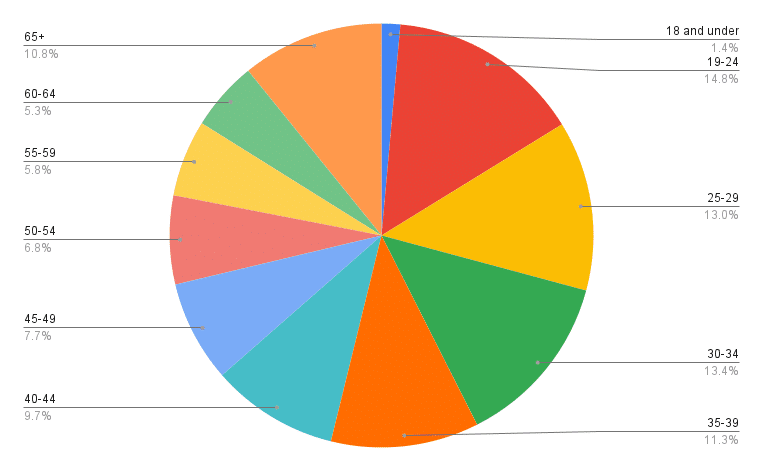
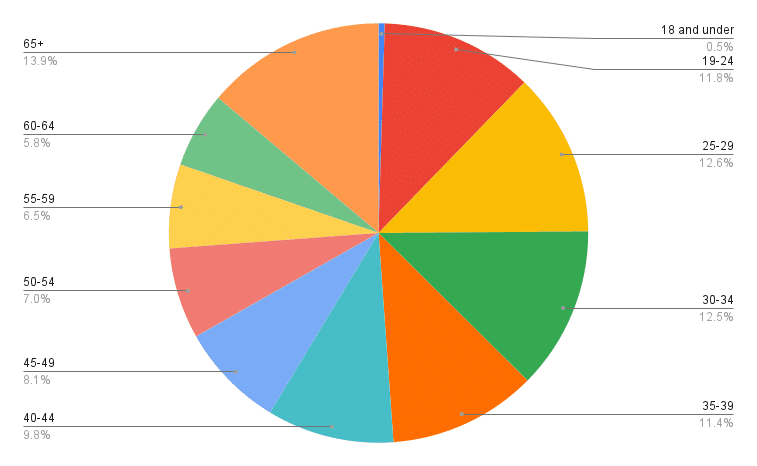
Age
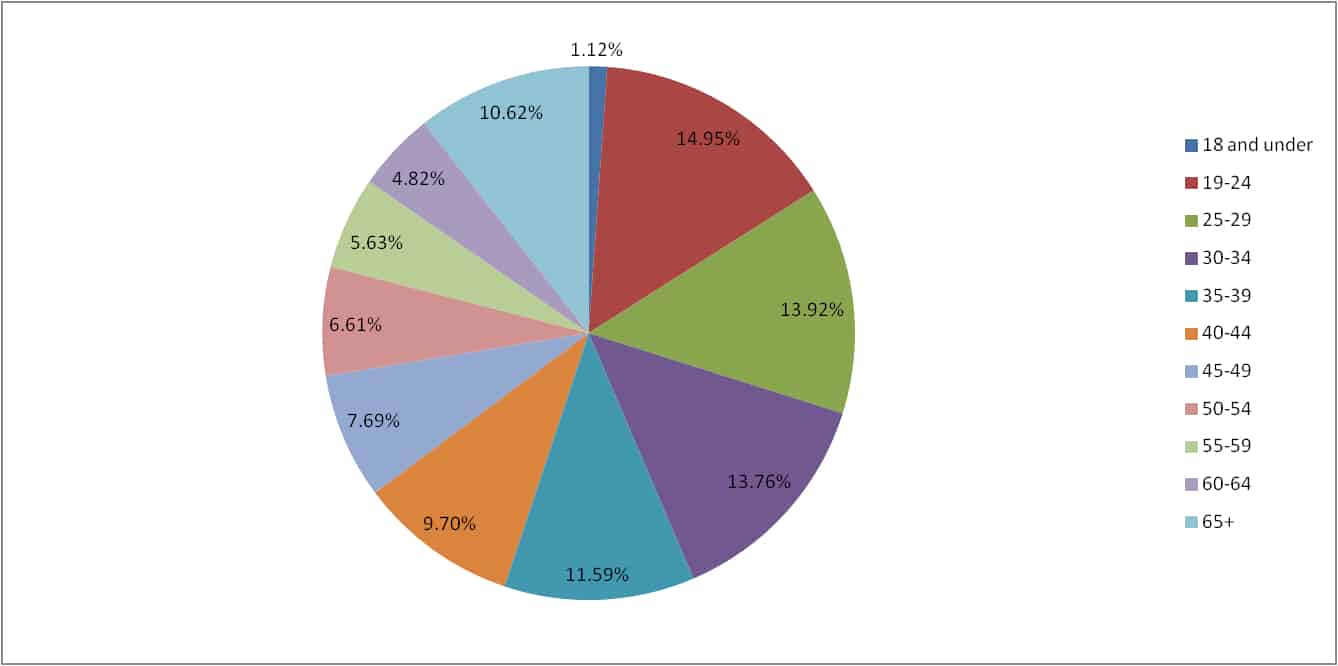
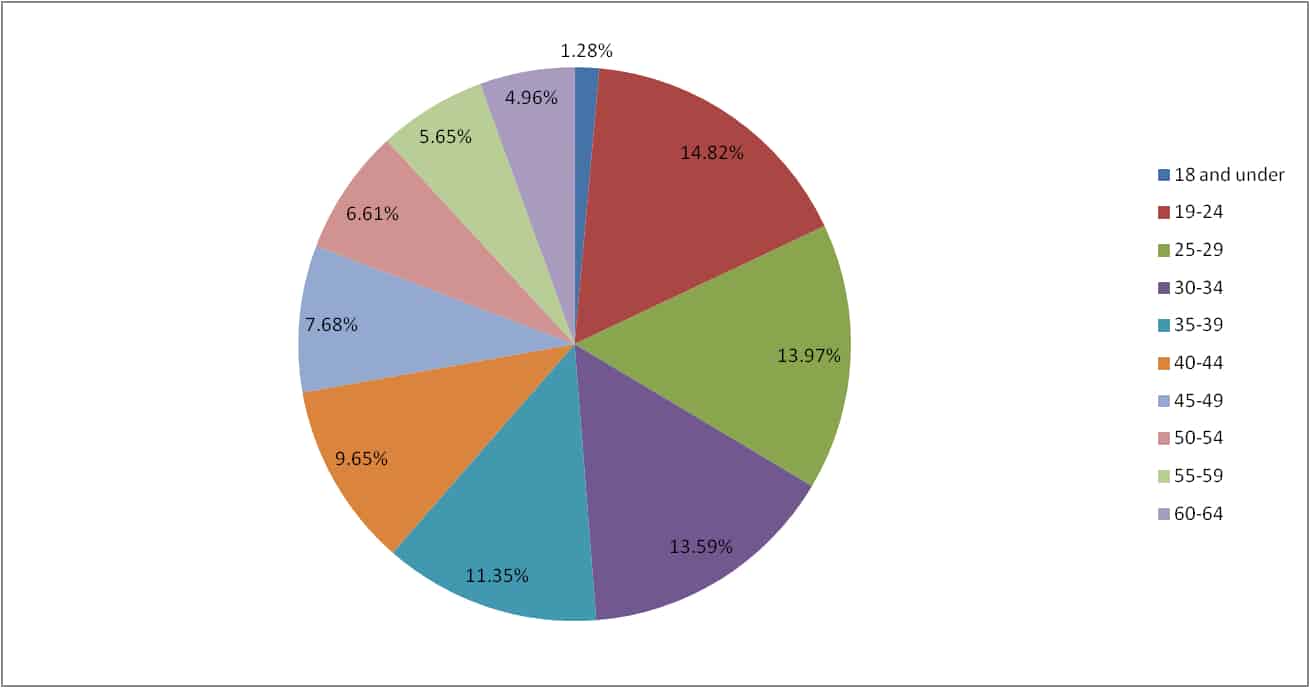
Age groupings shifted since we last did this report before this year ages so the data is a little different than before this year’s relaunch. While before “under 18” was one, it’s now “18 and under” with each subsequent grouping being 5 year blocks. This data is absolutely skewed as 1) It is believed younger individuals don’t use Facebook as much in the past and have migrated to other platforms; and 2) Laws restrict what can be collected based on age, ie those under the age of 13 shouldn’t even have accounts. So, younger readers are absolutely under-counted.
This month’s stats are interesting in there was a drop of 18 and under while slight gains for those over 65. The rest remained relatively the same as the previous month.
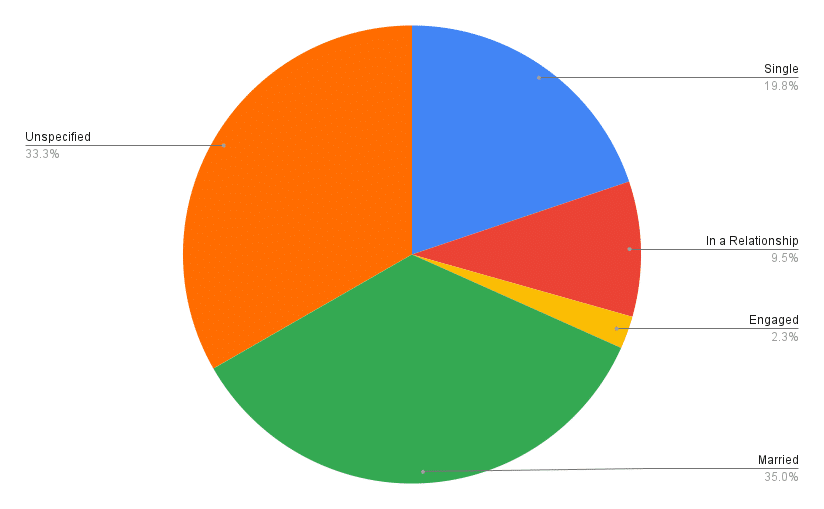
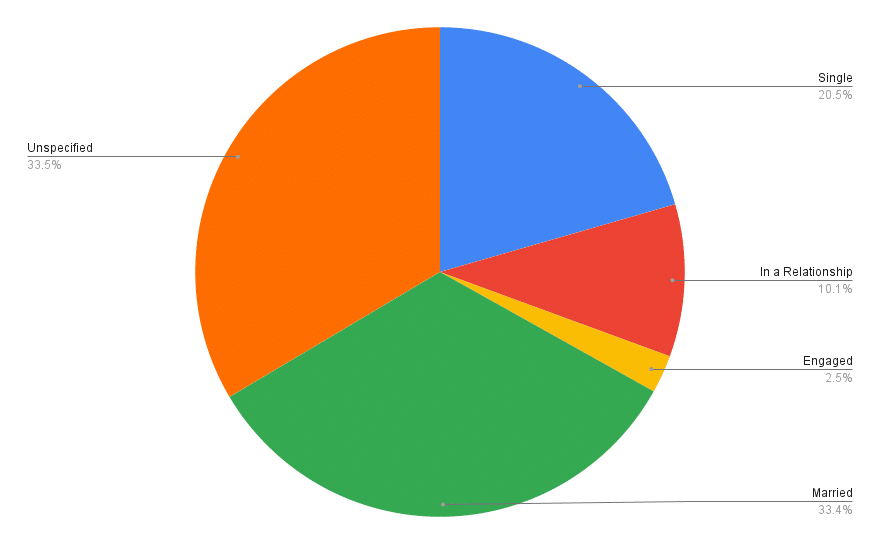
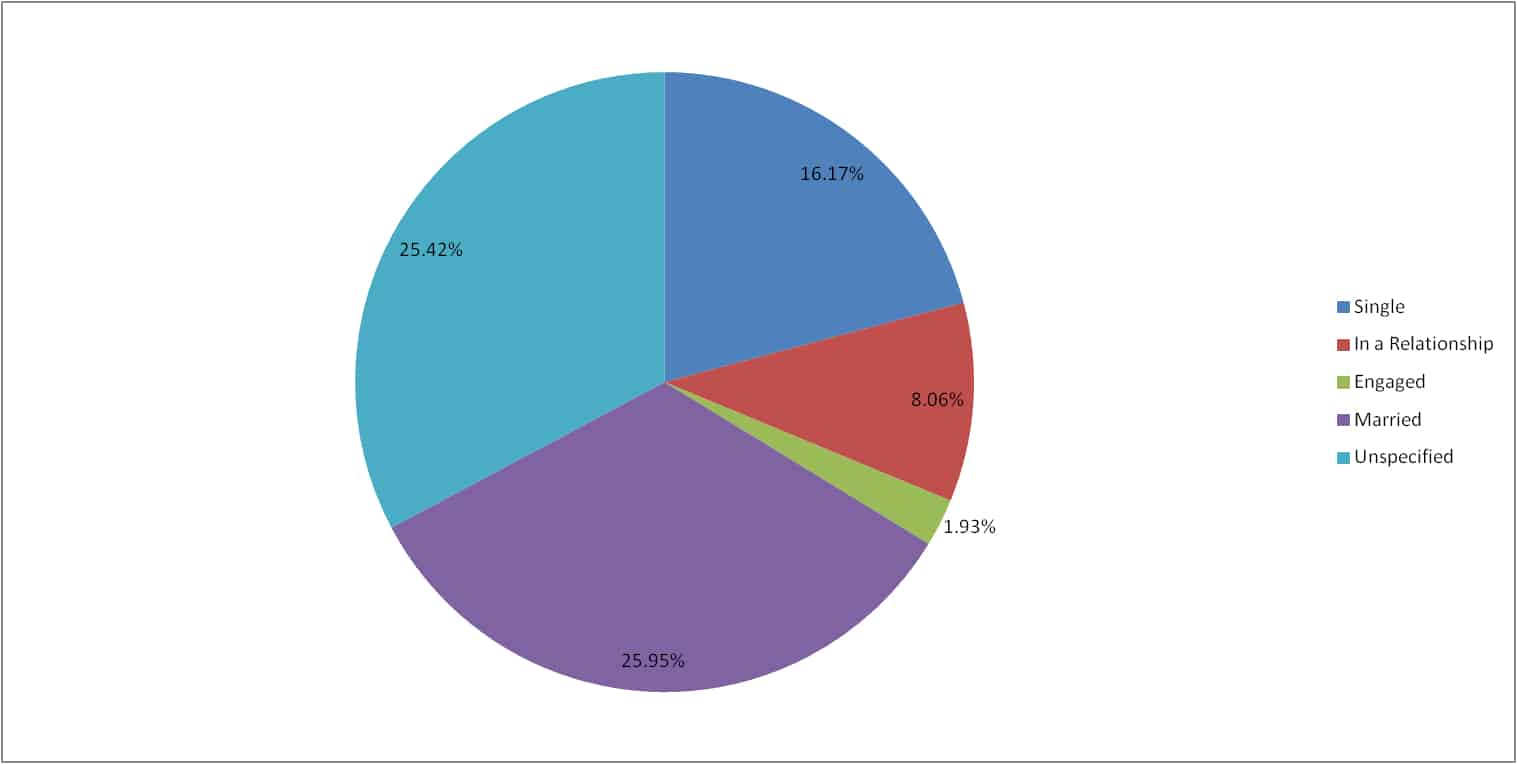
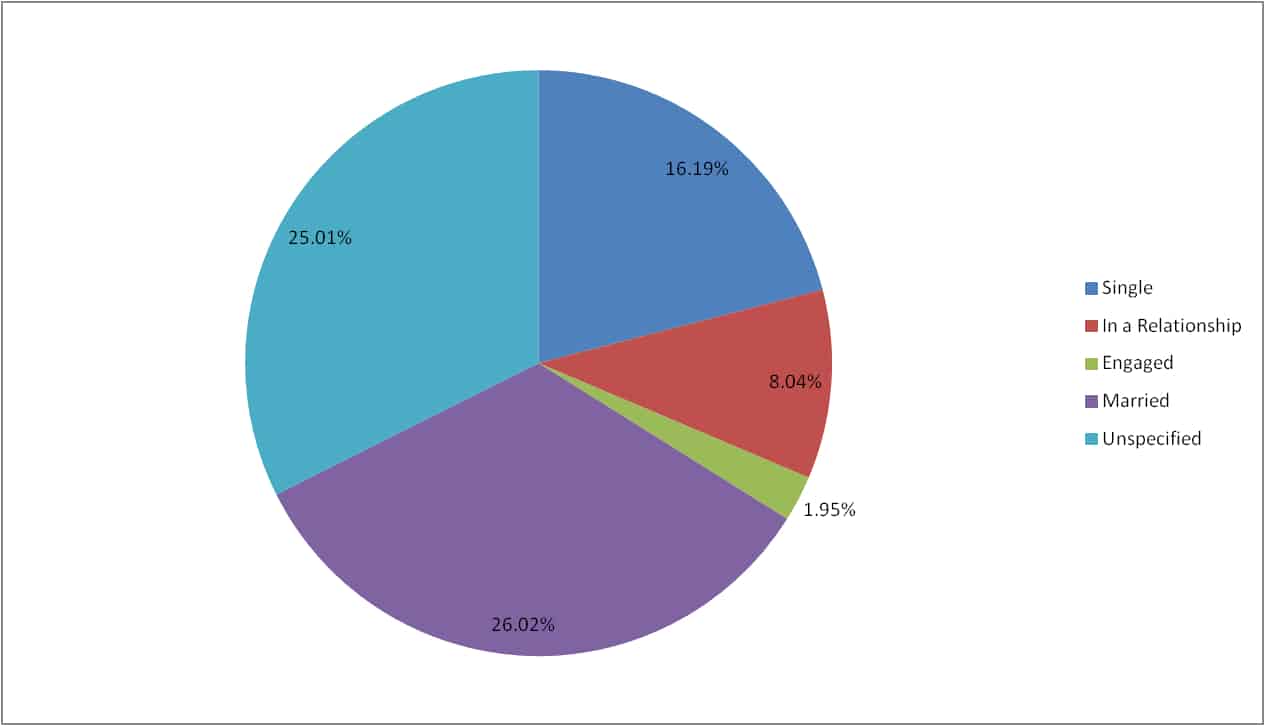
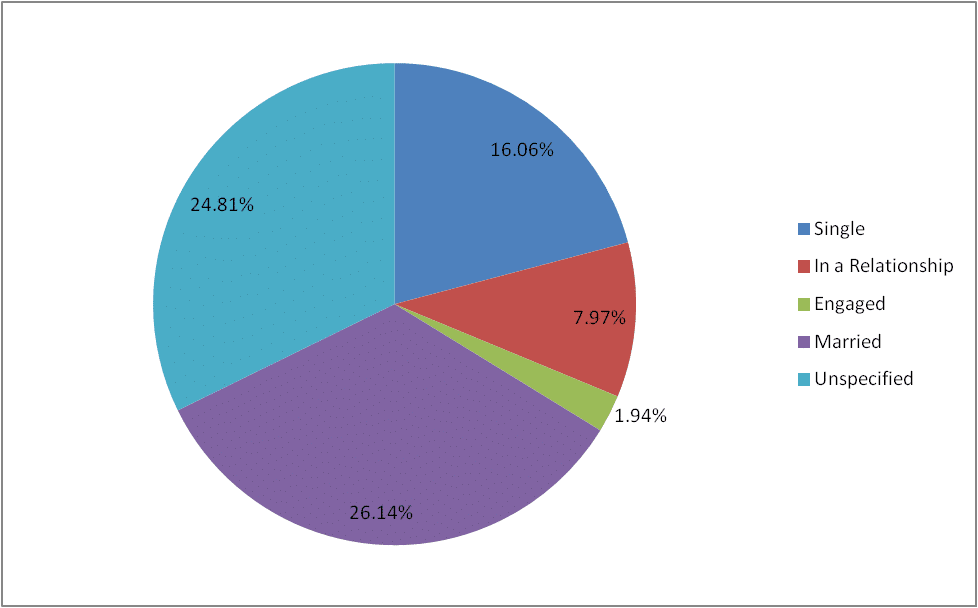
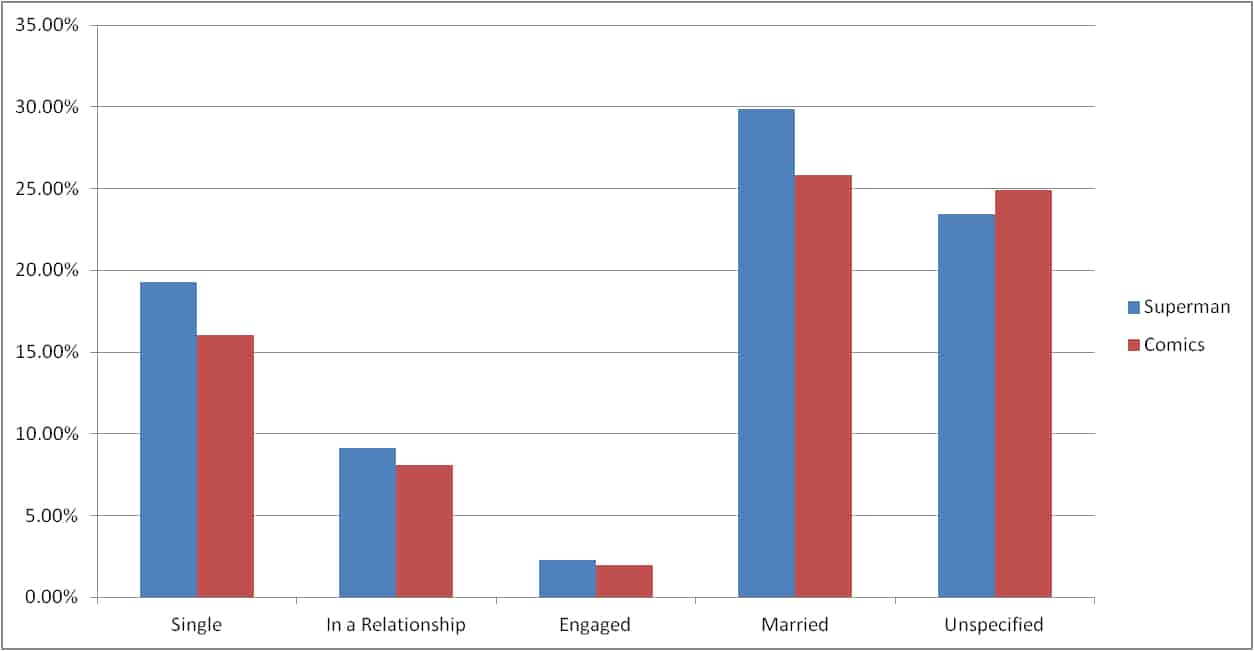
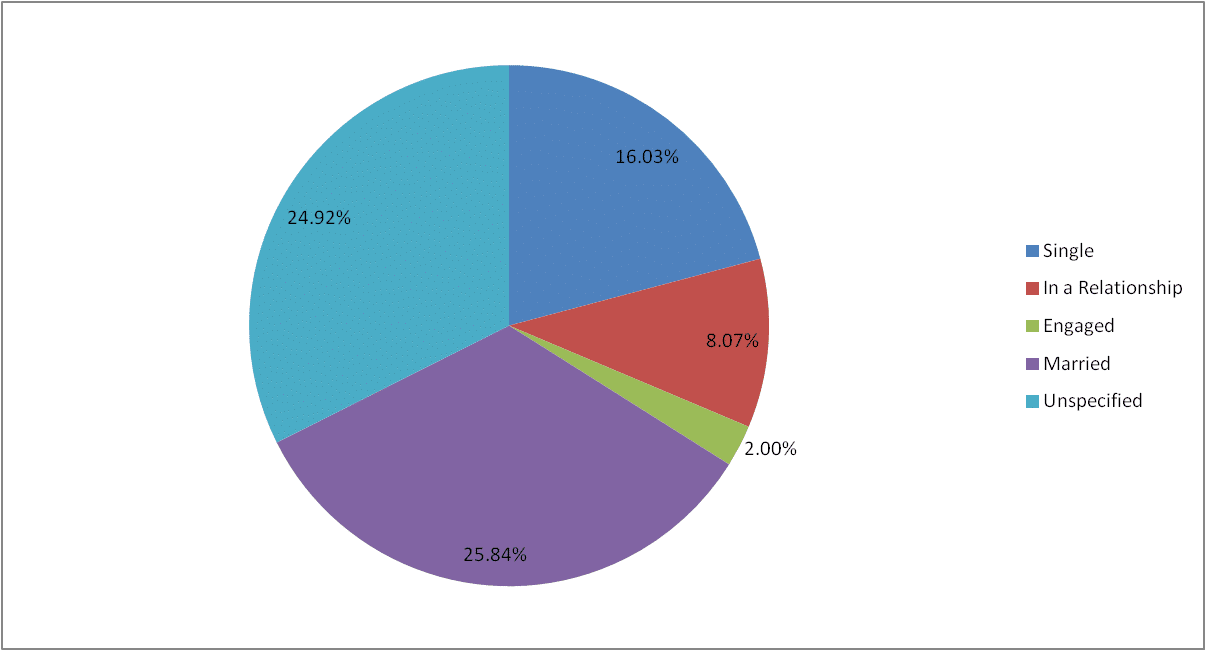
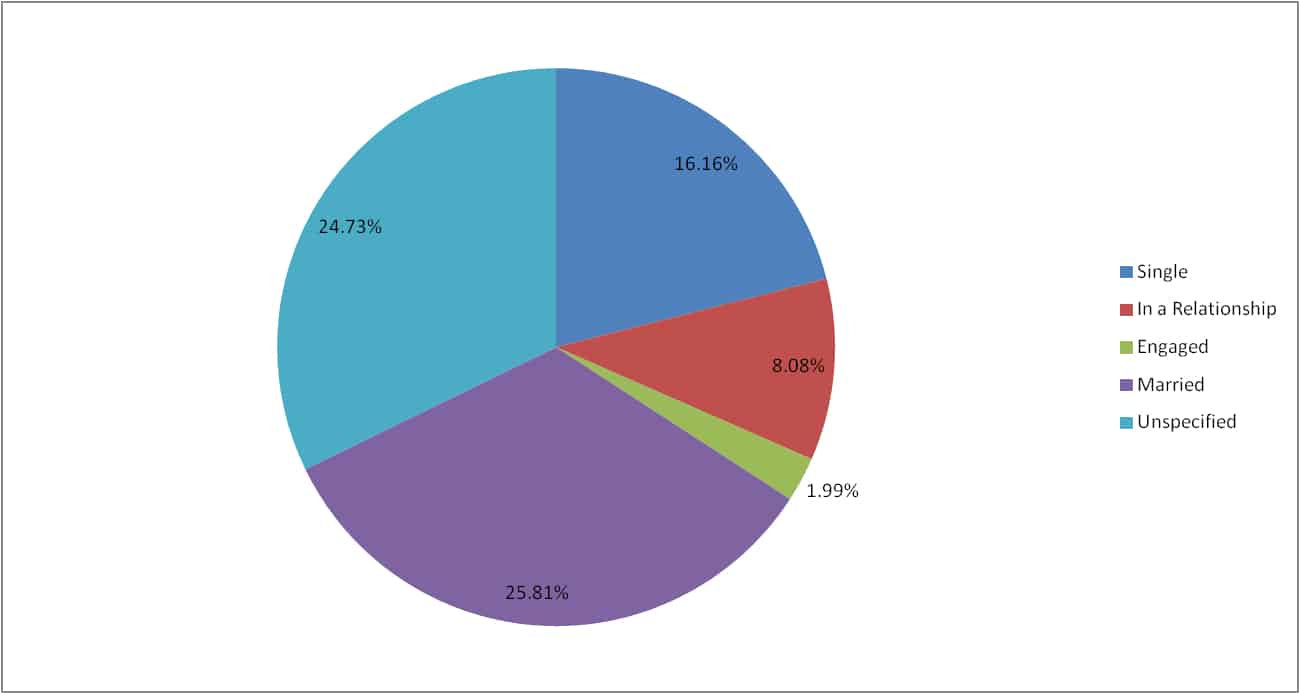
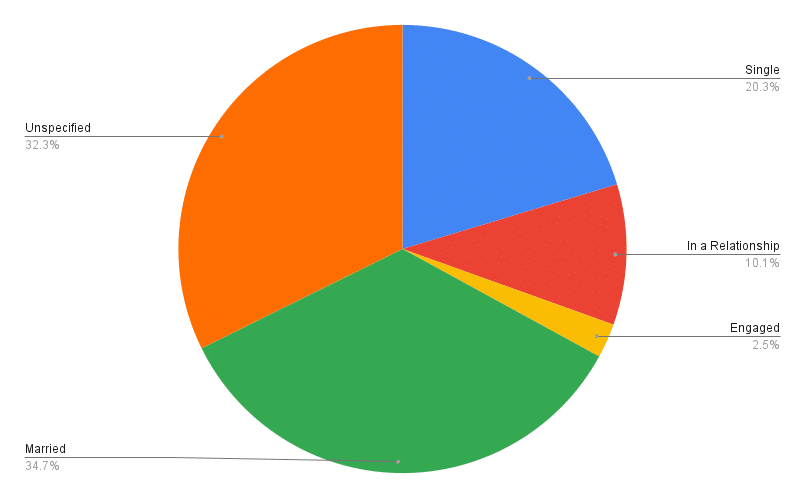
Relationship Status
This stat is the outlier from everything. Nearly every group dropped from the previous month, though those unspecified increased a little. Overall fewer individuals are reporting this data than the previous month.

New Stats!
Education has been combined to see how many individuals have at least a college degree. This past month saw a slight decrease from 35.25 million the previous month to 34.9 million, that’s 29.4% of the population. In 2024, 31.3% of the American population had at least a college degree.
24.8 million fans, 20.89%, are parents! That’s a sizeable decrease of 2.5 million since the previous month which was 27.3 million.
And finally, what’s the crossover with fans of board games and video games? 55.5 million, 46.76% of comic fans also enjoy board/tabletop/card games, an increase due to the inclusion of more terms in the search. 65.05 million, 54.80% also enjoy video games, a decrease from the previous month. Combined, 87.55 million like board games or video games and 32.65 million enjoy board games and video games. Get your licensing engines revving!
What’s Next?
All of this is a re-starting point. Things have shifted in how I’m collecting the data, like age, but it’s been quite a while since I’ve regularly done this. As we move along, we’ll continue to look at trends over time.
There’s some legacy data I’m going to try and fill in so we can get a better sense of how things have shifted over time that will hopefully be available next month. And, part of that will be me trying to find the original data files from many computers ago. Lots of work so we can all have a better sense of where things stand! Until next time… what gets measured, gets done!