
Where the Data Ranks 2017’s (and 2018’s) Comic Book Films. Black Panther Passes Titanic
Black Panther dropped just 27% in its eighth weekend. The film earned an estimated $8.4 million domestically, the film has earned $665 million. That makes it the third highest grossing domestic release of all-time passing Titanic (not adjusted for inflation). It would have to earned another $95 million to pass Avatar which is in second place.
Internationally, the film added $4.5 million to tat total to bring its international earnings to $635 million for a worldwide total just shy of $1.3 billion.
The film is still earning far more domestically than the average Marvel film with 51.2% earned versus 41.1% on average. International earnings seem to have slowed down as the percentage has increased for the domestic ever so slightly.
The Death of Stalin came in at #18 this past weekend slipping just one slot from last week. The film brought in $1.11 million and added 70 theaters. It’s now showing in 554 theaters. The film has earned $5.6 million domestically. It debuted internationally last year, with controversy in Russia. It has also earned $9.05 million in foreign markets. The film has passed Supergirl, Jonah Hex, and Punisher: War Zone and currently sits at #44 for worldwide earnings for comic adaptations.
I Kill Giants still is a weird one when it comes to numbers. So far, only its earnings in Russia has been reported. It opened March 29 in that region. The film earned $127,713.
We’ll have a deeper analysis of 2018’s releases as more are released but lets do the time warp to 2017…
Justice League looks like it has wound down its run settling at a respectable $657.9 million. Wile the film had the lowest domestic gross of a film as part of the DC Cinematic Universe, it also had the second highest international gross. The film earned a 65.19% internationally, the highest of a DC film. On average, the films earn 58% internationally. That’s the highest percentage of any DCU film internationally.
Thor: Ragnarok looks to have earned a few hundred dollars and now stands at $854 million.
2017 has been a record year for comic adaptations. The films have earned $2.365 billion domestically beating the previous year’s $1.901 billion. Internationally, films have earned $3.755 billion beating the previous record of $3.215 billion set in 2014. Worldwide comic adaptations have earned $6.120 billion beating the 2016 record of $5.026 billion. “Profits” too have seen a record year with $4.442 billion versus 2016’s record of $3.812 billion.
We’ll continue to report on 2017’s statistics until all dollars are in, at least a few more weeks.
Lets compare how the big two comic companies compare for earnings. Black Panther is included, so Marvel’s totals will increase over time. On average DC films earn $317.6 million domestically while Marvel earns $333.1 million. Internationally, Marvel rules with $494.2 million and DC lags behind with $435.7 million.
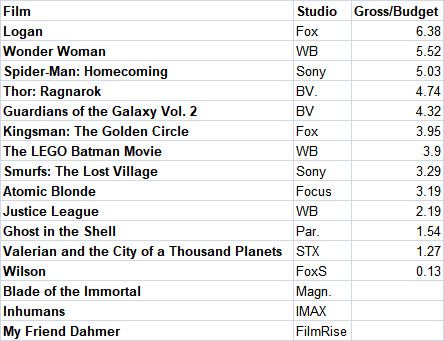
2017 has had five clear successes and a whole lot of mixed otherwise. Thor: Ragnarok, Wonder Woman, Logan, Spider-Man: Homecoming, and Guardians of the Galaxy Vol. 2 have done well this year. My Friend Dahmer, Justice League, Kingsman: The Golden Circle, The LEGO Batman Movie and Smurfs: The Lost Village, and Atomic Blonde are in that debatable area. Valerian, Wilson, Ghost in the Shell, and Blade of the Immortal are generally disappointments. Marvel’s Inhumans… got no clue and tough to debate since it’s a television show primarily with a limited film engagement.
Here’s where this year’s comic films stand as far as the actual numbers. With a new film opening the averages have dipped.
Total Domestic Gross: $2.365 billion
Total International Gross: $3.755 billion
Worldwide Gross: $6.120 billion
Total Reported Budgets: $1.667 million
Total “Profit”: $4.442 billion
Average Domestic Gross: $147.8 million
Average International Gross: $268.2 million
Average: Worldwide Gross: $382.5 million
Average Budget: $128.2 million
Average Profit: $254.2 million
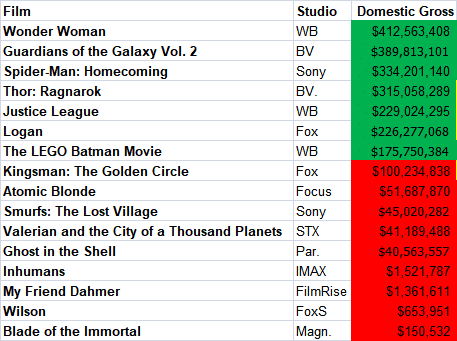
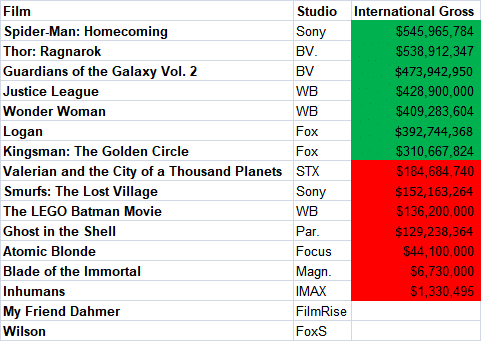
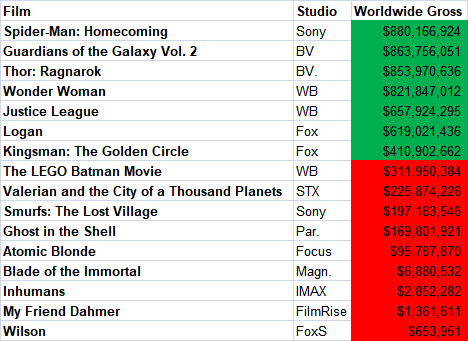
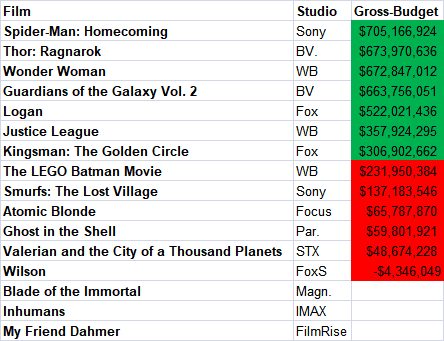
Below is where the films released stand when it comes to being compared to this year’s averages. Those in green are above average while those below are red.
Discover more from Graphic Policy
Subscribe to get the latest posts sent to your email.